Abstract
Oxidative stress and mitochondrial permeability transition (MPT) are important mechanisms in acetaminophen (APAP) toxicity. The MPT inhibitor trifluoperazine (TFP) reduced MPT, oxidative stress, and toxicity in freshly isolated hepatocytes treated with APAP. Since hypoxia inducible factor-one alpha (HIF-1α is induced very early in APAP toxicity, a role for oxidative stress in the induction has been postulated. In the present study, the effect of TFP on toxicity and HIF-1α induction in B6C3F1 male mice treated with APAP was examined. Mice received TFP (10 mg/kg, oral gavage) prior to APAP (200 mg/kg IP) and at 7 and 36 h after APAP. Measures of metabolism (hepatic glutathione and APAP protein adducts) were comparable in the two groups of mice. Toxicity was decreased in the APAP/TFP mice at 2, 4, and 8 h, compared to the APAP mice. At 24 and 48 h, there were no significant differences in toxicity between the two groups. TFP lowered HIF-1α induction but also reduced the expression of proliferating cell nuclear antigen, a marker of hepatocyte regeneration. TFP can also inhibit phospholipase A2, and cytosolic and secretory PLA2 activity levels were reduced in the APAP/TFP mice compared to the APAP mice. TFP also lowered prostaglandin E2 expression, a known mechanism of cytoprotection. In summary, the MPT inhibitor TFP delayed the onset of toxicity and lowered HIF-1α induction in APAP treated mice. TFP also reduced PGE2 expression and hepatocyte regeneration, likely through a mechanism involving PLA2.
Keywords: Acetaminophen, Mitochondrial Permeability Transition, Phospholipase A2, Mitochondria, Toxicity
INTRODUCTION
Acetaminophen (paracetamol, N-acetyl-p-aminophenol, APAP) toxicity is a very common cause of acute liver failure in the United States (Larson et al., 2005). The role of metabolism in the initiation of APAP toxicity was reported over 40 years ago (Jollow et al., 1973; Mitchell et al., 1973). In addition, oxidative stress has been implicated to be important in the mediation of toxicity (Laskin et al., 1994; Hinson et al., 1998; Knight et al., 2001). The nitration of proteins in APAP toxicity has been recognized, implicating the involvement of the nitrating and oxidizing species peroxynitrite as a mechanism in the development of toxicity (Hinson et al., 1998; Knight et al., 2001).
Mitochondrial permeability transition (MPT) is another mechanism of toxicity in APAP mediated liver injury (Lemasters et al., 1999; Kon et al., 2004; Reid et al., 2005). MPT represents an abrupt increase in the permeability of the inner mitochondrial membrane that results in the loss of ATP and eventual cellular necrosis. The loss of ATP in APAP toxicity was previously demonstrated by Jaeschke et al (Jaeschke, 1990). MPT inhibitors, such as cyclosporine A (CYC), have been previously tested using in vitro models of APAP toxicity (Lemasters, 1999; Kon et al., 2004; Reid et al., 2005). In addition, MPT inhibitors have been shown to be beneficial in a number of animal models of cellular injury. For example, NIM811, a CYC analogue, decreased mitochondrial dysfunction and remnant liver injury in a mouse model of massive partial hepatectomy (Rehman et al., 2011). Few studies have examined the effect of MPT inhibitors on APAP toxicity in vivo. We recently reported that the MPT inhibitor CYC decreased toxicity in mice, but CYC also markedly inhibited the metabolism of APAP (Chaudhuri et al., 2010), precluding further study with this compound.
The transcription factor HIF-1α is a master regulator of adaptive responses of cells to hypoxia. The HIF-1 complex is composed of two protein subunits known as HIF-1β, which is constitutively expressed, and HIF-1α, which is not present in normal cells but is induced under hypoxic conditions. The HIF-1α subunit is continuously synthesized and degraded by the prolyl hydroxylase system under normoxic conditions, while it accumulates rapidly following exposure to low oxygen tensions. HIF-1α may also be induced by oxidative stress. HIF-1α is induced in the early stages of APAP toxicity in the mouse and in freshly isolated hepatocytes incubated under a stream of oxygen (James et al., 2006). Moreover, HIF-1α induction occurs at sub-toxic doses of APAP, suggesting the presence of low levels of oxidative stress (Chaudhuri et al., 2010) without overt toxicity (eg., ALT elevation). Treatment of mice with low dose CYC reduced HIF-1α, supporting the hypothesis that HIF-1α induction in APAP toxicity is secondary to oxidative stress. However, high dose CYC inhibited the metabolism of APAP, preventing further studies with this compound. To further examine the role of MPT in APAP toxicity, the effect of the MPT inhibitor trifluoperazine (TFP) was studied in APAP treated mice. Previous studies have shown TFP to be protective in APAP toxicity but mechanisms of the protection were not well defined (Yamamoto, 1990; Dimova et al., 1995). We hypothesized that TFP would reduce toxicity in mice treated with high doses of APAP and that treatment with TFP would reduce HIF-1α induction in the liver. Since TFP is also a phospholipase A2 inhibitor, the effects of TFP on the cyclooxygenase pathway were examined, in addition to later events in APAP toxicity.
MATERIALS AND METHODS
Drugs and Reagents
APAP was obtained from Sigma Chemical Co. (St. Louis, MO). Trifluoperazine was obtained from Sigma-Aldrich Co. (St. Louis, MO) Coomassie Plus Protein Assay Reagent was purchased from Pierce Chemical Co. (Rockford, IL). DTT (dithiothreitol; Cleland’s reagent) was obtained from Bio-Rad Laboratories (Hercules, CA). Gills Hematoxylin II and Permount were acquired from Fisher Scientific, Inc. (Pittsburgh, PA). Anti-HIF-1α monoclonal antibody was purchased from Novus Biologicals (Littleton, CO) and diluted 1:1000 immediately before use.
Experimental Animals
Six-week old male B6C3F1 mice (mean weight, 25.1 g) were obtained from Harlan Sprague Dawley (Indianapolis, IN). All animal experimentation was in accordance with the criteria of the “Guide for the Care and Use of Laboratory Animals” prepared by the National Academy of Sciences. Protocols for animal experimentation were approved by the University of Arkansas for Medical Sciences Animal Care and Use Committee. Mice were acclimatized one week prior to the planned experiments and fed ad libitum. Animals were housed 3 per cage and maintained on a 12 h light/dark cycle. On the day prior to experiments, mice were fasted overnight and dosing studies began at 0800 the following morning. Food was returned to the mice 4 h after APAP. In a preliminary dose response study, TFP was administered by oral gavage (5, 7.5 or 10 mg/kg; 3 mice/dose group) one hour before administration of APAP (200 mg/kg) IP. Other mice received APAP (200 mg/kg). Control mice received saline IP. Mice were sacrificed at 1 or 2 h after APAP. In the time course study, the APAP/TFP mice received additional doses of TFP by oral gavage (10 mg/kg) at 7 and 36 h after APAP (Yamamoto, 1990; Dimova et al., 1995). The mice were sacrificed at 1, 2, 4, 8, 24, or 48 h after APAP (6-7 mice/dose group). Animals were anesthetized with CO2 for blood sampling. Blood was removed from the retro-orbital plexus, allowed to coagulate at room temperature, centrifuged, and the serum was used for measurement of alanine aminotransferase (ALT). Mice were then euthanized in a CO2 atmosphere followed by cervical dislocation and removal of the livers. The livers were weighed and a portion was preserved in formalin for histological sections. The remaining livers were snap frozen in liquid nitrogen and stored at -80° C for additional analyses.
Liver Histology
Hematoxylin and eosin (H&E) staining was performed for histological examination of the liver samples. A reviewer blinded to treatment group examined the liver sections and scored them for hepatocellular necrosis and hemorrhage using a 0 (no lesion) to 4 (severe change) scoring system that included lobular localization as per previous publications (Chaudhuri et al., 2010).
Metabolism and Toxicity Assays
Serum ALT levels were measured using an Alera chemistry analyzer (Alfa Wassermann, West Caldwell, New Jersey). APAP covalently bound to protein in liver was measured by initial protease treatment of liver homogenates, followed by high performance liquid chromatography-electrochemical (HPLC-EC) analysis for APAP-cysteine as previously described (Muldrew et al., 2002). Glutathione (GSH) was measured using Ellman’s reagent as previously described (Rehman et al. 2011; Yamamoto, 1990).
HIF-1α nuclear extraction
HIF-1α expression was measured by western blot as previously described (James et al., 2006). Liver tissue for HIF-1α was prepared using Active Motif’s (Carlsbad, CA) Nuclear Extract kit. Briefly, 30 ug of protein was separated by SDS-PAGE and blocked for 1 h at room temperature and then incubated in the primary monoclonal antibody (Novus Biologicals, Littleton, CO) was used at a dilution of (1:1000) overnight at 4°C. A peroxidase-conjugated goat anti-mouse IgG secondary antibody (Santa Cruz Biotechnology Inc, Santa Cruz, CA) was used (1:2000 dilution) for 1 h at room temperature. Band detection was performed using ECL Plus detection (Amersham, Piscataway, NJ).
Expression of Proliferating Cell Nuclear Antigen (PCNA)
Immunoblots of mouse liver for PCNA expression were performed using a monoclonal antibody (Carpentaria, CA) at 1:500 as per our previous publications (Donahower et al., 2006). In addition, immunohistochemical assays for PCNA in liver sections was performed as per our previous publication (Donahower et al., 2006), using a mouse monoclonal PCNA antibody (Dako, Carpinteria, CA) (1:75) and Gills Hematoxylin II as the counterstain. Quantification of PCNA staining of hepatocyte nuclei was performed using Aperio imaging. Quantitative pathological analysis hardware and software, Aperio Scanscope T2 and ImageScope software (Aperio, Vista, CA), were used to quantify the staining in the proliferating hepatocyte nuclei in each tissue section.
Growth factor and cytokine assays
Supernatants of homogenized liver were assayed for vascular endothelial growth factor (VEGF) using an ELISA kit available from R & D (Minneapolis, MN) as per our previous publications (Donahower et al., 2006). Serum samples were analyzed for tumor necrosis factor alpha (TNFα) using an ELISA kit available from Enzo Life Sciences (Plymouth Meeting, PA).
PLA2 activity and PGE2 levels in liver
PLA2 activity in liver was measured using a PLA2 activity kit (Cayman Chemicals, Ann Arbor, MI) as per the manufacturer’s instructions and following published methods (Reyes et al., 2006). Liver samples were homogenized and centrifuged at 14,000 for 40 min using a cellulose membrane filter with a cut-off of 30 kDa (Spin-X 500 UF Concentrators, 30K MWCO, Corning Scientific, Wilkes Barre, PA) to separate the PLA2 isoforms. The higher molecular weight fraction was used to measure cPLA2 activity and the lower molecular weight fraction was used to measure sPLA2 activity. To avoid the measurement of iPLA2 in the sample, bromoenol lactone was used. Results are expressed as nmol/mg/mL. PGE2 was measured in liver homogenates using the Luminex Prostaglandin E2 kit from Cayman Chemicals (Ann Arbor, MI) as per the manufacturer’s instructions.
Statistical Analysis
Results are expressed as means ± SE. A p value of 0.05 was considered significant for all analyses. Comparisons between multiple groups were performed by one-way analysis of variance followed by the Tukey HSD post-hoc test. Non-parametric analysis (Kruskal Wallis and Mann Whitney) were used for analysis of data that was not normally distributed. SPSS Version 10.0 (SPSS Inc., Chicago, IL) was used for all statistical analyses.
RESULTS
Dose response study of trifluoperazine and APAP metabolism
In preliminary dose response studies, B6C3F1 male mice received the MPT inhibitor TFP at three doses (5.0, 7.5, or 10 mg/kg) by oral gavage 1 h prior to APAP (200 mg/kg IP). Other mice received APAP (200 mg/kg IP) only. Control mice received saline IP. Mice were sacrificed at 1 or 2 h and blood and liver were removed for analysis. APAP reduced GSH by approximately 90% (Fig. 1A) and the APAP/TFP mice had GSH levels that were comparable to the APAP mice at 1 and 2 h. In addition, hepatic APAP protein adducts were increased in the APAP and the APAP/TFP mice compared to saline mice, and there were no differences in adduct levels between the APAP/TFP mice and the APAP mice (Fig. 1B). Thus, the data demonstrated that the three tested doses of TFP did not alter the metabolism of APAP.
Fig. 1.
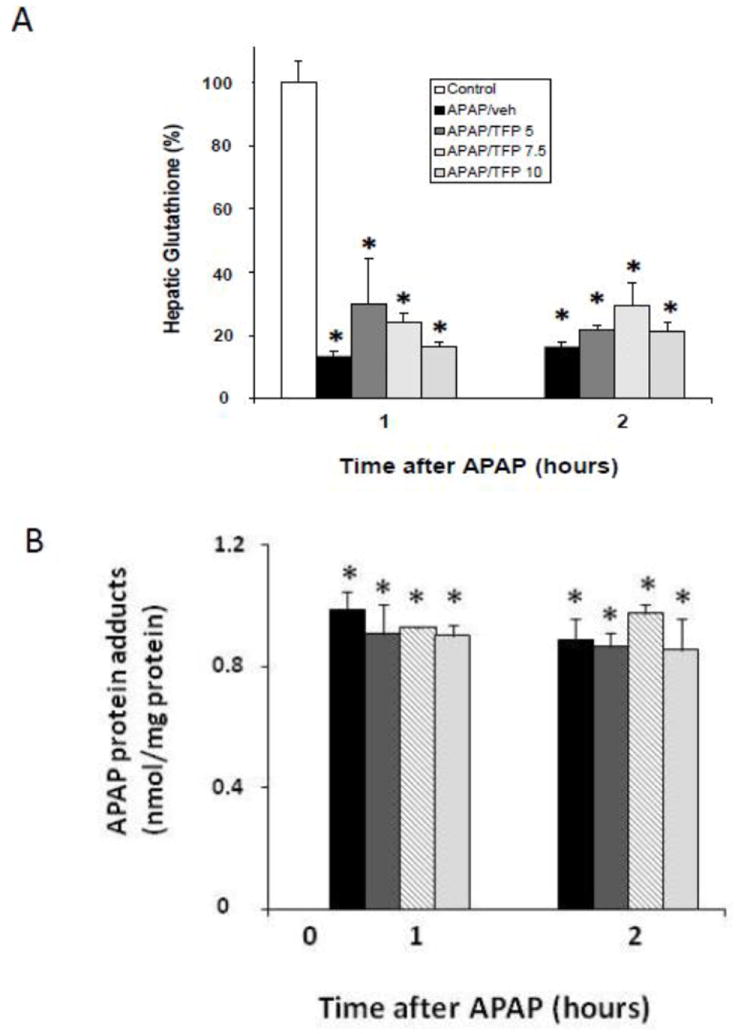
Hepatic glutathione and APAP protein adducts in dose response study of TFP in APAP toxicity in the mouse. Mice were treated with TFP (5.0, 7.5, or 10 mg/kg by oral gavage) 1 h prior to APAP (200 mg/kg IP) and sacrificed at 1 or 2 h. A. Depletion of hepatic glutathione (GSH) in APAP and APAP/TFP mice at 1 and 2 h compared to saline mice (*p<0.05). B. APAP protein adducts in liver in APAP and APAP/TFP mice compared to saline mice (*p<0.05). No differences were detected in adduct levels among the three doses of TFP.
Effect of trifluoperazine on APAP toxicity
In subsequent studies, a time course study was performed in APAP and APAP/TFP mice. TFP (10 mg/kg) was administered to mice by oral gavage 1 h prior to APAP and then again at 7 and 36 h after APAP (200 mg/kg IP). Mice were treated with APAP (200 mg/kg IP) and sacrificed at the indicated times. Serum ALT was significantly increased at 2, 4, 8, and 24 h in the APAP mice and peaked at 8 h. In contrast, ALT levels in the APAP/TFP mice were 75 to 82% lower at 2, 4, and 8 h than the corresponding ALT values in the APAP mice. In addition, the peak of ALT was delayed in the APAP/TFP mice (Fig. 2).
Fig. 2.
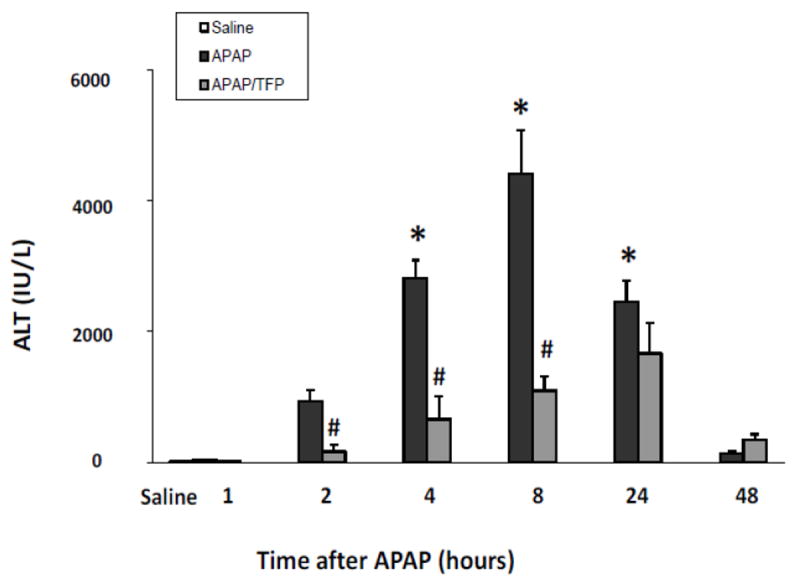
Time course of serum ALT levels in APAP and APAP/TFP mice. Mice were treated with TFP (10 mg/kg oral gavage) 1 h prior to and at 7 and 36 h after APAP (200 mg/kg IP). ALT levels were increased at 4, 8 and 24 h in the APAP mice (*p<0.05). ALT levels were reduced in the APAP/TFP mice compared to the APAP mice (#p<0.05) at 2, 4, and 8 h.
Histologic analysis of liver sections by a blinded reviewer indicated reduced necrosis in the APAP/TFP mice at 4 and 8 h (Fig. 3A) compared to the APAP mice at these time points (#p<0.05). In addition, the extent of hemorrhage was reduced in the APAP/TFP mice at 8 h compared to the APAP mice (Fig. 3B; #p<0.05). A cumulative score reflecting the combined necrosis and hemorrhage scores showed differences between the two groups of mice at 4 and 8 h (Fig. 3C; #p<0.05). At both 24 and 48 h, there were no significant differences in ALT levels between the APAP and APAP/TFP mice. Thus, TFP delayed the onset of APAP toxicity. Figure 3D-F demonstrates the histology of representative saline, APAP and APAP/TFP mice at 8 h. Similar to the data presented in Figure 1, hepatic GSH depletion and APAP protein adduct formation were comparable between the APAP and APAP/TFP mice (Fig 4).
Fig. 3.
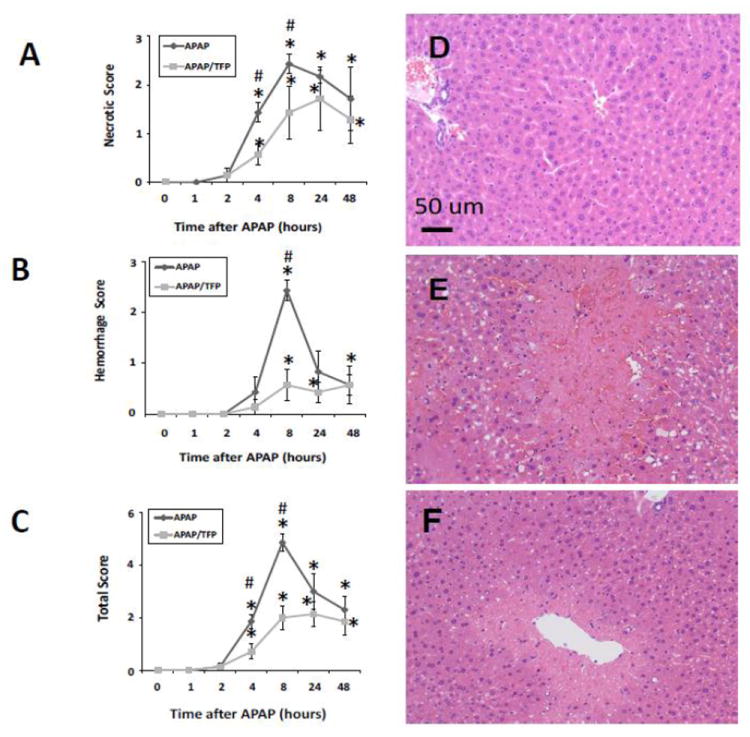
Histologic scoring for (A) necrosis, (B) hemorrhage, and (C) combined parameters in saline, APAP and APAP/TFP mice over time. Liver sections were scored by a blinded reviewer. *represents comparison to saline; #represents comparison to APAP (p<0.05). (D) representative saline mouse, (E) representative APAP mouse at 8 h showing extensive necrosis and hemorrhage, (F) representative APAP/TFP mouse at 8 h showing reduced necrosis and hemorrhage.
Fig. 4.
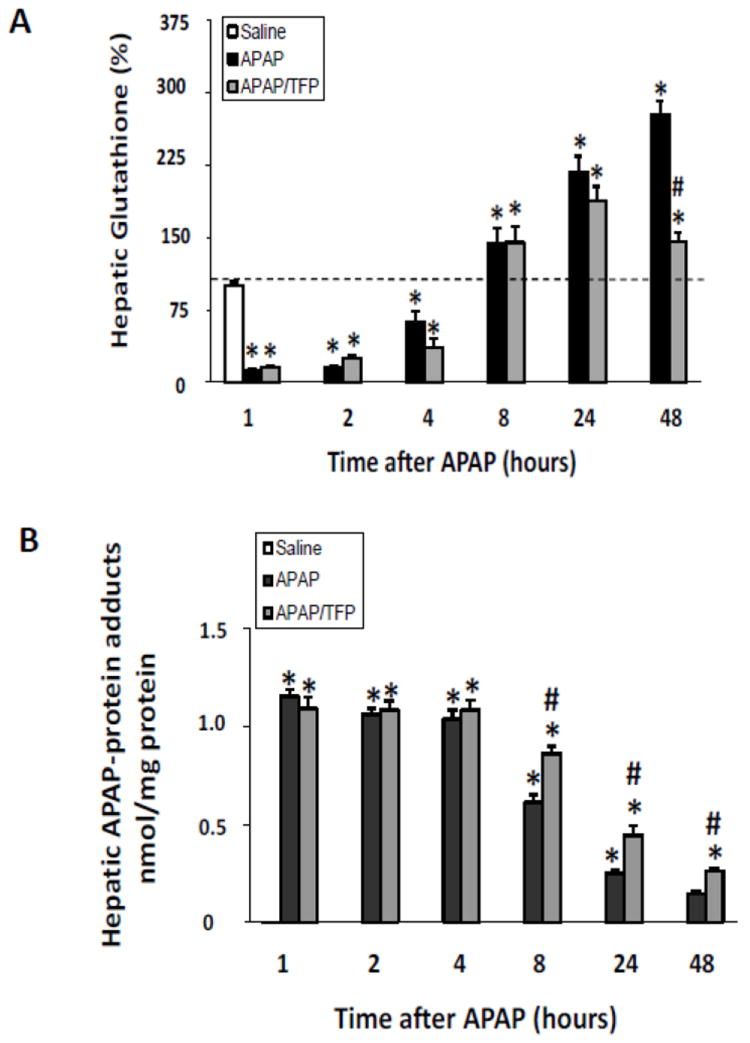
Hepatic glutathione and APAP protein adducts in time course study of TFP in APAP toxicity in the mouse. Mice were treated with TFP (10 mg/kg by oral gavage) 1 h prior to APAP (200 mg/kg IP) and sacrificed at the designated times. A. Hepatic glutathione (GSH) levels in APAP and APAP/TFP mice were comparable at 1, 2, 4, 8, and 24 h (*p<0.05) compared to saline, while hepatic GSH was higher in the APAP/TFP mice at 48 compared to the APAP mice at 48 h. B. APAP protein adducts in liver in APAP and APAP/TFP mice compared to saline mice APAP protein adducts were increased to comparable levels in the two APAP groups compared to saline at 1, 2, and 4 h (*p<0.05). Adducts were higher at 8, 24, and 48 h in the APAP/TFP mice compared to APAP mice (#p<0.05).
Effect of trifluoperazine on HIF-1α induction
We previously reported that low dose CYC (10 mg/kg) reduced HIF-1α induction in APAP toxicity (James et al., 2006). However, high dose CYC (50 mg/kg) inhibited the metabolism of APAP, limiting further study with this compound (James et al., 2006). Thus, the effect of the MPT inhibitor TFP on HIF-1α induction was examined. Western blot assays of the nuclear extracts of liver homogenates demonstrated the induction of HIF-1α at 1 h in the APAP mice, which persisted throughout the time course of toxicity and appeared to be greatest at the 4 and 8 h time points, consistent with previous data (James et al., 2006). In contrast, the APAP/TFP had reduced induction of HIF-1α at 1, 2, 4, 8, and 24 h (Fig. 5) compared to the APAP mice. The induction of HIF-1α was greatest in the APAP/TFP mice at 4 h and decreased at 8 h, following administration of the second dose of TFP to the mice. Differences in HIF-1α induction between the APAP and APAP/TFP mice were confirmed by densitometry analysis of individual lanes for each of the groups (Fig. 5; #p<0.05).
Fig 5.
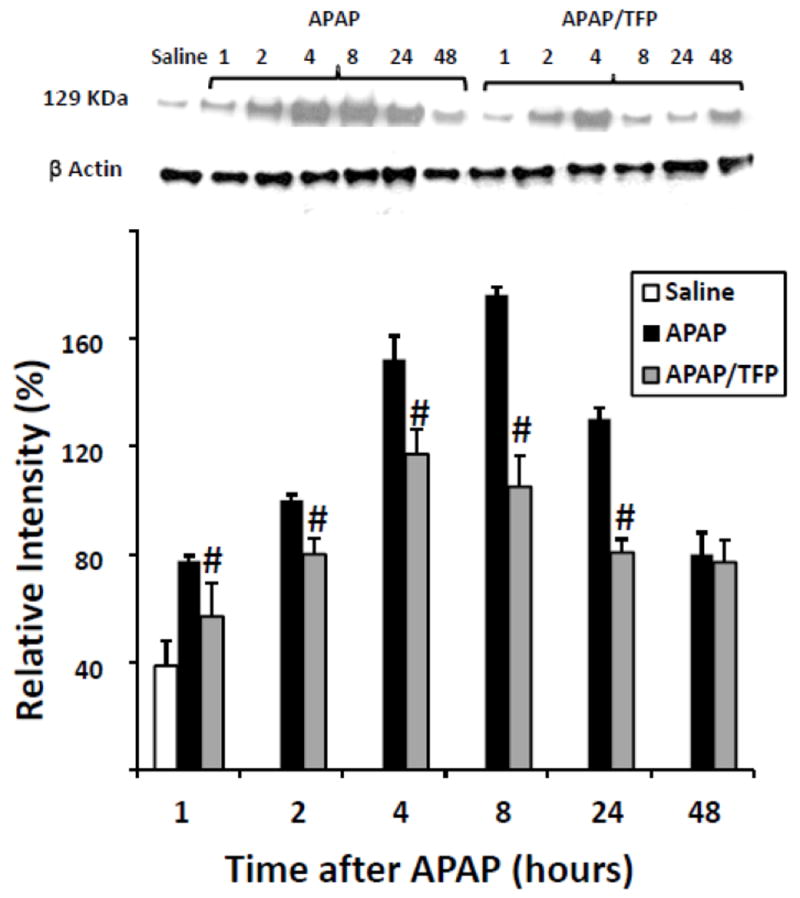
Expression of HIF-1α by immunoblot in APAP and APAP/TFP mice. Nuclear expression of HIF-1α was increased at 1 h in the APAP mice and throughout the time course of APAP toxicity. HIF-1α expression was reduced in the APAP/TFP mice (#p<0.05, compared to APAP mice) through the 24 h time point, as indicated by the immunoblot and confirmed by the densitometry. Representative individual mice are shown in the immunoblot.
Effect of TFP on hepatocyte regeneration and expression of VEGF and TNFα
In previous work, we observed the induction of PCNA, a marker of hepatocyte regeneration, at the 24 h time point in APAP toxicity in the mouse (Donahower et al., 2006). To examine the effect of TFP on the liver repair response, western blot assays for PCNA were performed. A robust response in PCNA expression was observed in the APAP mice at 24 h (Fig. 6A). In contrast, PCNA expression in the APAP/TFP mice was virtually absent in the mice at 24 h. By 48 h, the APAP mice had strong expression of PCNA, while some mice in the APAP/TFP group had little evidence of hepatocyte regeneration. An additional group of mice was treated as described above and sacrificed at 72 h. In this experiment, PCNA expression was also reduced in the APAP/TFP mice compared to the APAP mice, but showed evidence of rebound (Fig 6B) compared to the 24 and 48 h time points (Fig 6A).
Fig. 6.
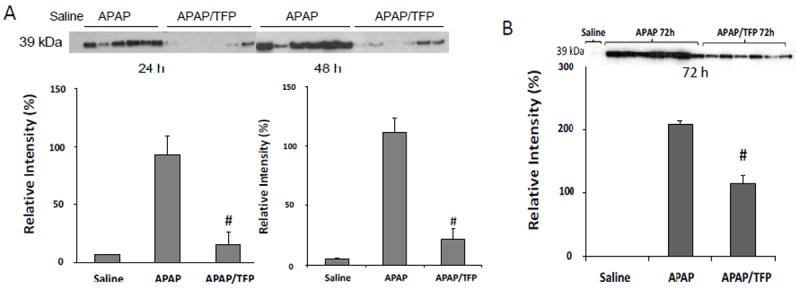
Hepatocyte regeneration in APAP and APAP/TFP mice. A. Proliferating cell nuclear antigen (PCNA) expression was measured by immunoblot in the APAP and APAP/TFP mice. PCNA expression was increased in the APAP mice at 24 and 48 h and absent or very decreased in the APAP/TFP mice at 24 and 48 h. Densitometry of PCNA expression in APAP and APAP/TFP mice demonstrated reduced PCNA expression in the APAP/TFP mice (#p<0.05) compared to the APAP mice. B. PCNA expression by immunoblot at 72 h in an additional experiment of APAP and APAP/TFP mice. The APAP/TFP mice had reduced expression of PCNA at the 72 h time point (#p<0.05) compared to the APAP mice.
To further examine hepatocyte regeneration in the mice, immunohistochemical staining of liver sections for PCNA was performed, followed by quantitative image analysis. Figure 7 demonstrates scattered brown nuclear staining in the midzonal regions of the APAP mice at 24 that increased in amount and localized to the centrilobular areas by 48 h. By 72 h, the PCNA staining had a diffuse pattern of distribution in the hepatic lobules of the APAP mice. In contrast, the APAP/TFP mice had marked reduction of PCNA staining in hepatocytes at all time points. Despite these differences in PCNA expression in the two groups of mice, all animals survived the experimental protocol.
Fig. 7.
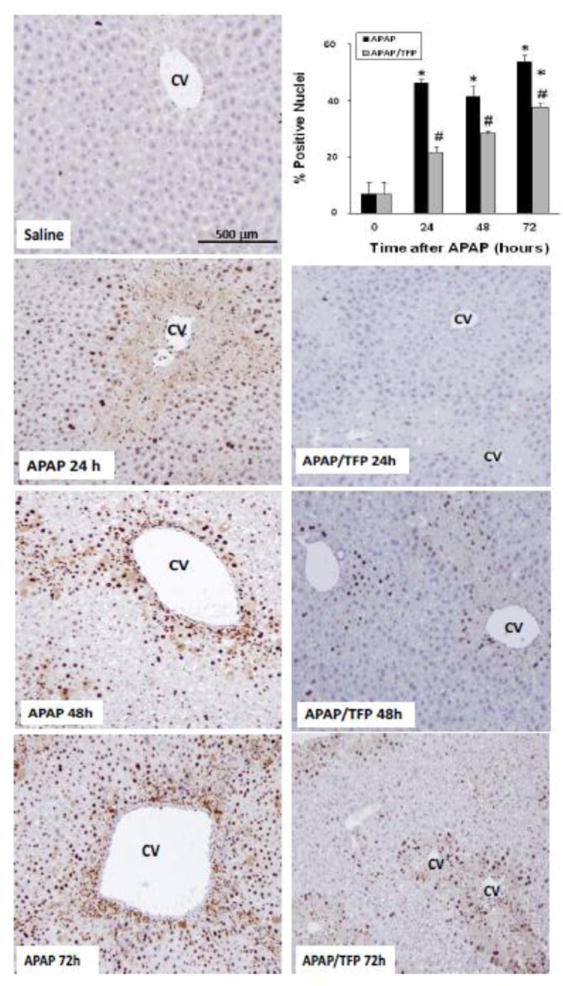
Time course of PCNA immunohistochemical staining in liver in saline, APAP and APAP/TFP mice. No staining was apparent in the saline treated mice. The APAP mice had brown nuclear staining in the midzonal hepatocyte nuclei at the border of the centrilobular area at 24 h. At 48 h, the staining localized to the centrilobular areas and by 72 h, the staining was diffuse in distribution. Reduced staining was apparent at all time points in the APAP/TFP mice. PCNA staining was quantified by Aperio image analysis as demonstrated in the bar graph and showed reduced staining in the APAP/TFP mice at 24, 48, and 72 h (#p<0.05) compared to the APAP mice at the same time points.
In previous work, treatment of mice with compounds that reduce VEGF signaling delayed the repair response in APAP treated mice (Donahower et al., 2006). Conversely, exogenous treatment with recombinant VEGF enhanced the repair response (Donahower et al., 2010). Since VEGF is a major target of HIF-1α induction (Semenza, 1998), levels of VEGF were measured in the two groups of mice. VEGF levels were initially elevated at 8 h in the APAP mice (Fig. 8A), consistent with previous data (Donahower et al., 2006). VEGF levels in the APAP/TFP mice were 60% higher than the APAP mice at 8 h (#p<0.05) and similar differences in VEGF levels between the two groups were noted at 24 h. By 48 h, VEGF levels in the two groups of mice were comparable.
Fig. 8.
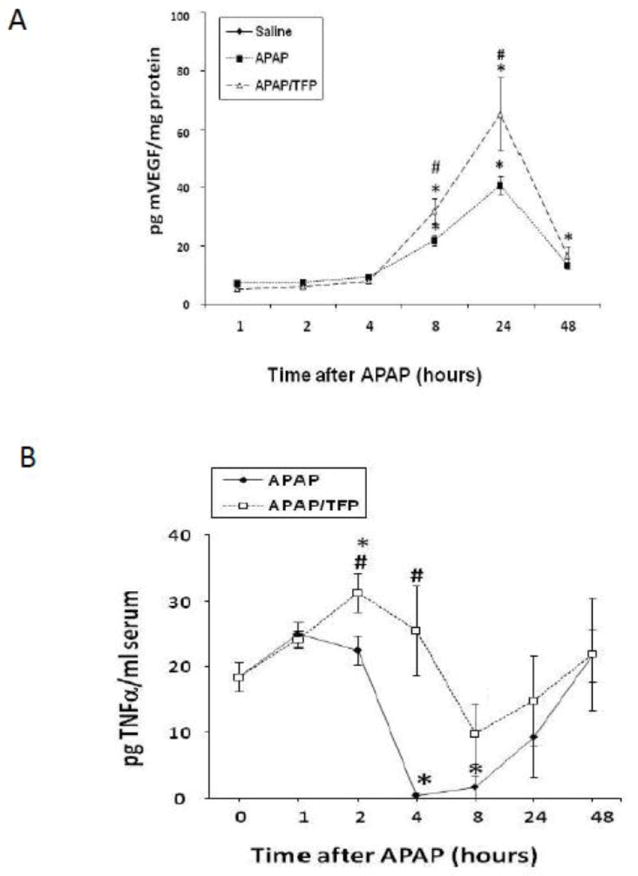
VEGF and TNFα levels in APAP and APAP/TFP mice. A. Hepatic levels of vascular endothelial growth factor in APAP and APAP/TFP mice. VEGF was increased above saline (*p<0.05) at 8 and 24 h in the APAP and APAP/TFP mice. VEGF was significantly higher in the APAP/TFP mice compared to the APAP mice at 24 h (#p<0.05). B. Serum levels of TNFα. TNFα was increased above saline in the APAP/TFP mice at 2 h (*p<0.05) and significantly higher than the APAP mice at 4 h (#p<0.05).
Tumor necrosis factor alpha (TNFα) may have hepatoproliferative effects under certain conditions (Michalopoulos, 2010) and TNF receptor one (TNFR1) knockout mice treated with APAP had delayed hepatocyte regeneration (James, 2005). TNFα levels were higher in the APAP/TFP mice at 2 and 4 h, compared to the APAP mice (Fig. 8B). By 24 and 48 h, there were no differences in TNFα between the two groups of mice.
Effect of TFP on PLA2 Activity
In addition to its effects on MPT (Elimadi et al., 1997), TFP is also a PLA2 inhibitor. PLA2 specifically recognizes the sn-2 acyl bond of phospholipids and catalytically hydrolyzes the bond, releasing arachidonic acid and lysophospholipids. Activation of PLA2 is an important step in host defense and signal transduction. Activity assays for cytosolic PLA2 (cPLA2) and secretory PLA2 (sPLA2) were performed to examine the temporal relationships of PLA2 activity to indicators of toxicity in the APAP and APAP/TFP mice. cPLA2 activity (Fig. 9A) in liver was increased above saline in the APAP mice at 4 and 8 h and peaked at 24 h (*p<0.05). In contrast, cPLA2 activity remained at baseline at all time points in the APAP/TFP mice. sPLA2 activity (Fig. 9B) was increased in the APAP mice at 8 h (*p<0.05), while it remained at baseline in the APAP/TFP mice at all time points. Thus, cPLA2 and sPLA2 had distinct patterns of increased activity in the APAP mice that were suppressed in the APAP/TFP mice.
Fig. 9.
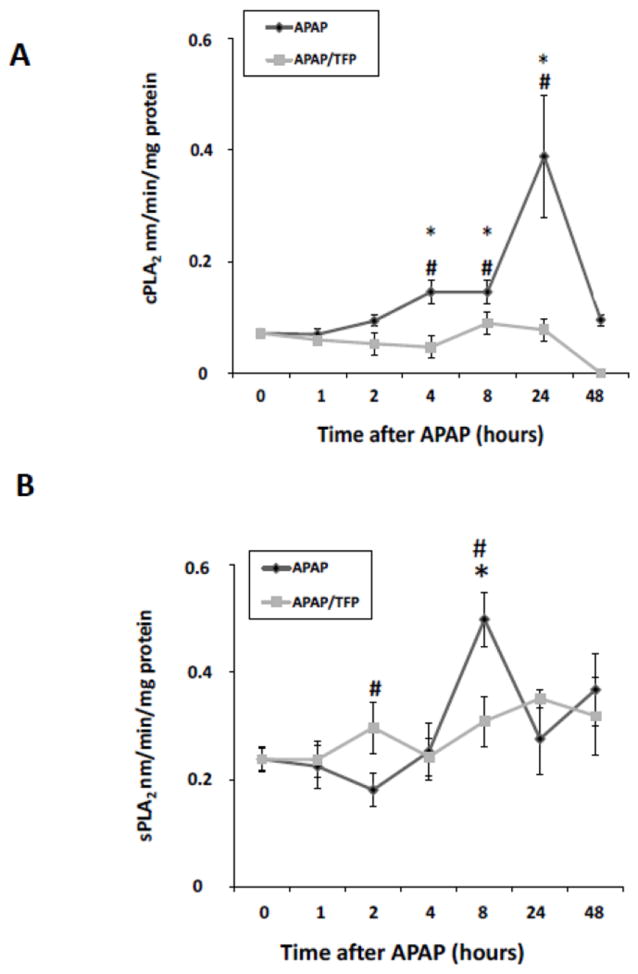
PLA2 activity levels in APAP and APAP/TFP mice. A. cPLA2 activity was increased in APAP mouse liver at 4, 8, and 24 h (*p<0.05) and remained at baseline in the APAP/TFP mice. B. sPLA2 activity was increased in APAP mouse liver at 8 h and remained at baseline in the APAP/TFP mice. #p<0.05 compared to the APAP mice.
Effect of TFP on PGE2 levels
PGE2 is the principal metabolic product of cyclo-oxygenase-2 and is increased in APAP toxicity (Reilly et al., 2001). In addition, PGE2 facilitates cell proliferation in models of hepatic resection (Casado et al., 2001; Schoen Smith & Lautt, 2005). As demonstrated in Figure 10, hepatic PGE2 levels were markedly increased during the later stages of toxicity in the APAP mice at 8, 24 and 48 h. In contrast, PGE2 levels were reduced at 8 and 24 h in the APAP/TFP mice, compared to the APAP mice. By 48 h, PGE2 levels were comparable in the two groups of mice. The data suggest that reduced PCNA expression in the APAP/TFP mice may be secondary to the inhibitory effects of TFP on PLA2 activity, resulting in reduced PGE2 expression.
Fig. 10.
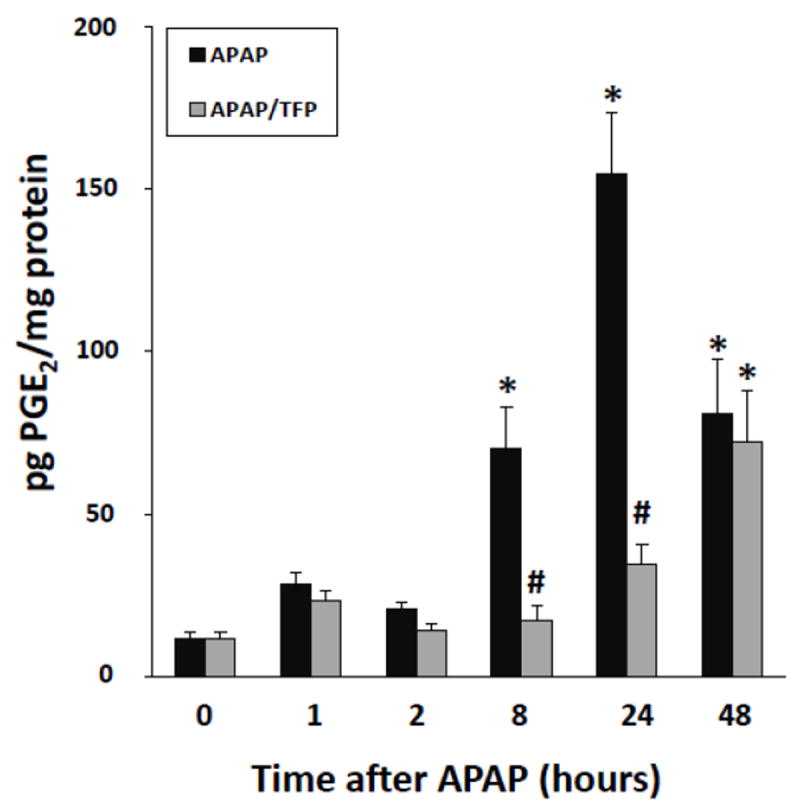
PGE2 levels in liver in APAP and APAP/TFP mice. PGE2 levels were increased above saline at 8 h in the APAP mice and remained elevated at 24 and 48 h (*p<0.05). In contrast, PGE2 levels remained at baseline in the APAP/TFP mice at 8 and 24 h (#p<0.05) and by 48 h were comparable to the APAP mice.
DISCUSSION
Previous in vitro studies of APAP toxicity have implicated MPT as a mechanism of cell death (Lemasters et al., 1998; Reid et al., 2005). MPT represents a permeabilization of the mitochondrial inner membrane with selectivity for solutes having a molecular mass of less than 1500 Da (Halestrap et al., 2002). Following the onset of MPT, mitochondria depolarize and swell and oxidative phosphorylation is uncoupled. The primary goal of the present study was to examine the effect of the MPT inhibitor TFP on toxicity and HIF-1α expression using an in vivo model of APAP toxicity. TFP has been shown to be hepatoprotective in APAP toxicity but the mechanisms of hepatoprotection were not well delineated (Yamamoto, 1990; Dimova et al., 1995). These earlier studies examined a single point in time, as opposed to the time course design utilized in the present study (Yamamoto, 1990; Dimova et al., 1995). TFP markedly reduced the severity of APAP toxicity at 2, 4, and 8 h, time points that reflect the early stages of toxicity (Fig. 2, 3). Examination of H & E sections for necrosis was consistent with the ALT data and also showed reduced hemorrhage in the APAP/TFP mice (Fig. 3B, 3F). In addition, TFP delayed the peak of toxicity until the 24 h time point. Importantly, TFP did not interfere with the metabolism of APAP, as indicated by comparable values for hepatic GSH and APAP protein adducts in the early stages of toxicity (Fig. 1).
The transcription factor HIF-1α is a master regulator of adaptive responses of cells to hypoxia. The induction of HIF-1 leads to upregulation of genes involved in angiogenesis (including VEGF), gluconeogenesis, cell proliferation and survival, and metabolic adaptation (Chandel et al., 2000; Salazard et al., 2004). While hypoxia is the best known mechanism for the induction of HIF-α, oxidative stress is another recognized trigger of HIF-1α induction (Chandel et al., 2000; Salazard et al., 2004). We previously postulated that HIF-1α induction in APAP toxicity is secondary to oxidative stress (Chaudhuri et al., 2010) and showed that HIF-1α induction occurs early in APAP toxicity (1 h) and occurs following sub-toxic dose exposure to APAP (Chaudhuri et al., 2010). In addition, HIF-1α induction in the early stages of APAP toxicity did not coincide temporally with hypoxia (pimonidazole) staining in mouse liver (Chaudhuri et al., 2010).
The effect of APAP toxicity on prolyl hydroxylase activity, a mechanism of HIF-1α stabilization associated with hypoxia, is unknown. We also found that low dose CYC (eg., 10 mg/kg) reduced HIF-1α induction while high dose CYC (50 mg/kg) inhibited the metabolism of APAP, limiting further study with CYC (Chaudhuri et al., 2010). In the present study, HIF-1α was induced at 1 h and peaked at 4 and 8 h in the APAP mice. The induction of HIF-1α was lower in the APAP/TFP mice throughout the time course, and in particular at the 8 h time point, following the second dose of TFP (Fig. 5).
In agreement with our data, Sparkenbaugh and colleagues recently reported that conditional depletion HIF-1α mice had protection from APAP toxicity at 6 h, but not at 24 h (Sparkenbaugh et al. 2011). Hepatoprotection was associated with reduced translocation of Bax and subsequent DNA fragmentation and changes in the coagulation system. No differences in VEGF expression were observed in the HIF-1α depletion mice at 6 h, a relatively early time point in the toxicity. Of interest, lower levels of interleukin 6 and interleukin 8, cytokines that have been associated with hepatocyte proliferation, were observed in the HIF-1α depletion mice, but hepatocyte regeneration per se was not examined (Sparkenbaugh et al. 2011).
In vitro models of cell toxicity found that CYC inhibits MPT by causing a desensitization of the permeability transition pore in mitochondria (Giorgio et al., 2010). Both CYC and TFP reduced mitochondrial swelling induced by Ca2+ or tert-bulylhydroperoxide and TFP reduced the extent of mitochondrial swelling (Elimadi et al., 1997). TFP is thought to have a more prolonged effect on MPT inhibition than CYC (Broekemeier & Pfeiffer, 1989; Castilho et al., 1995). Studies using flow cytometry imaging of isolated rat liver mitochondria showed that MPT occurred initially with Ca2+ influx, which was followed by the generation of reactive oxygen species, mitochondrial depolarization, mitochondrial swelling, and concluded with Ca2+ release; this sequence of events was inhibited by both CYC and TFP, in addition to other compounds known to be PLA2 inhibitors (Umegaki et al., 2008).
While TFP is an inhibitor of MPT, it is also known as a PLA2 inhibitor. PLA2 represents a family of enzymes that hydrolyze phospholipids at the sn2 ester bond, generating metabolic products that are important in inflammation, phospholipid metabolism, and signal transduction (Glaser, 1995). PLA2 consists of 6 groups (sPLA2, cPLA2, iPLA2, PAF-acetyl hydrolases [PAF-AH], lysosomal PLA2, and adipose PLA2). cPLA2 and sPLA2 have both been previously implicated to be involved in APAP toxicity (Bhave et al. 2011; Reilly et al. 2001). cPLA2 is intracellular and calcium dependent, and sPLA2 is extracellular and secreted. cPLA2 is considered a central mediator in the inflammatory response and has been implicated to be important in oxidant mediated cellular toxicity (Cummings et al., 2000). In the present study, cPLA2 activity was increased at 4, 8 and 24 h in the APAP mice and remained at baseline in the APAP/TFP mice until 8 h (Fig. 8A). Elevations in sPLA2 activity occurred in the APAP mice at 8 h, consistent with a role for sPLA2 in the progression of tissue injury as previously reported (Bhave et al. 2011), rather than the initiation of toxicity (Fig. 9B). In contrast, sPLA2 activity in the APAP/TFP mice remained at baseline throughout the time course study. The findings of the present study are consistent with a previous study in which COX-2 knockout mice had increased toxicity to APAP in the later stages of toxicity through a mechanism involving enhanced activity of sPLA2 (Bhave et al. 2011). Another report found that COX-2 knockout mice had increased toxicity to APAP and a defect in heat shock protein gene expression was observed (Reilly et al. 2001).
An unexpected finding of the present study was the reduced expression of PCNA in the APAP/TFP mice at 24 and 48 h (Fig. 6A, Fig. 7). By 72 h, rebounding PCNA expression was apparent in the APAP/TFP mice (Fig. 6B, Fig. 7). One explanation for the reduced PCNA response in the TFP mice is that the repair response was not initiated secondary to the lower levels of toxicity in the TFP mice. PCNA expression follows a dose response pattern in APAP toxicity (unpublished data). However, it is also likely that TFP had a direct effect on PCNA expression due to the PLA2 inhibitory effects of TFP. In support of this theory, previous studies have shown the activation of PLA2 and subsequent expression of PGE2 to be important in cellular proliferation (Fayard et al., 1998), including hepatocyte proliferation (Casado et al., 2001). While prostaglandins are generally regarded to be pro-inflammatory, an evolving body of literature supports the concept that prostaglandin E2 has wide ranging effects on many cell types, including effects on cell proliferation and survival. Increased expression of PGE2 was reported in the rat model of partial hepatectomy and a correlation was observed between increased PGE2 levels and PCNA expression, a marker of entry into S phase of the mitotic cycle (Casado et al., 2001). Conversely, Bhave found an association between reduced PGE2 and reduced DNA replication (Bhave et al., 2011). North found that PGE2 promoted hepatocyte regeneration in the zebrafish model of APAP toxicity (North et al., 2010). In addition, a recent report found that PGE2 given as a rescue therapy at 2 h was hepatoprotective in APAP toxicity in the mouse at 20 to 22 h (Cavar et al., 2012). In addition, a mechanism involving reduction of nuclear factor kappa B (NF-κB) was implicated. Treatment with agonists of PGE2 receptors stimulated the induction of the anti-apoptotic protein Bcl-2 in vitro (Ushio et al., 2004) and treatment of Jurkat cells with PGE2 protected these cells from apoptotic stimuli (George et al., 2007). In the present study, reduced levels of PGE2 were observed in the APAP/TFP mice at 8 and 24 h and by 48 h, PGE2 levels were comparable between the two groups of mice. The temporal sequence of reduced PGE2 levels, followed by reduced PCNA expression, suggests that TFP had a direct effect on hepatocyte regeneration. Despite the observed reduction in PCNA expression in the APAP/TFP mice, all mice survived the experimental protocol.
The potential effect of TFP on mitochondrial phospholipases in APAP toxicity is unknown. Increased PLA2 activity has been linked to cell toxicity associated with CYP2E1 metabolism (Caro & Cederbaum, 2003). PLA2 activity was found to be increased in HepG2 cells over-expressing CYP2E1 that are exposed to arachidonic acid and the oxidant iron (Caro & Cederbaum, 2003). Exposure of these cells to arachidonic acid and iron resulted in the activation of PLA2, while treatment of cells with PLA2 inhibitors reduced toxicity, but had no effect on MPT per se (Caro & Cederbaum, 2003).
In contrast, Broekemeier showed that TFP and CYC both independently inhibited MPT in isolated mitochondria exposed to oxidative stress (Broekemeier & Pfeiffer, 1995). However, TFP did not alter mitochondrial free fatty acid accumulation in vitro, suggesting that the MPT effects of TFP did not involve mitochondrial phospholipases (Broekemeier & Pfeiffer, 1995). Other data suggest that TFP inhibits MPT by changing the surface membrane charge, thus altering the sensitivity of the mitochondria to MPT (Broekemeier & Pfeiffer, 1995; Halestrap et al., 2002). Further study is required to determine whether or not TFP has effects on MPT in APAP toxicity through a mechanism specifically involving mitochondrial PLA2.
VEGF is important in hepatocyte regeneration in APAP toxicity (Donahower et al., 2006; Donahower et al., 2010; Kato et al., 2011) and is a target of HIF-1α upregulation (Semenza, 1998). Echinomycin, a small molecule inhibitor of HIF-1 DNA binding, lowered VEGF protein expression in APAP toxicity in mice (Micheli-Halle, 2011). Despite lower HIF-1α induction, APAP/TFP mice had relatively higher levels of hepatic VEGF at 8 and 24 h, compared to the APAP mice (Fig. 8A). The lack of association between HIF-1α induction and VEGF expression in the present study suggest the involvement of other mechanisms controlling VEGF expression. Kotch showed that HIF-1α deficient embryos had normal VEGF expression and a mechanism involving hypoglycemia was implicated in the regulation of VEGF (Kotch et al., 1999). One interpretation of the data from Fig 8 is that the relative increases of VEGF levels in the APAP/TFP mice, compared to the APAP mice, may represent an attempt to compensate for reduced PGE2 expression and reduced hepatocyte regeneration (Figs 6, 7). TNFα may also regulate VEGF expression (Hitchon et al., 2002), but its role in APAP toxicity is complex as it has been reported to have both pro-inflammatory and hepatocyte proliferative effects (Boess et al., 1998; Ishida et al., 2004). The increased levels of TNFα in the APAP/TFP mice at 2 and 4 h may also represent an incomplete compensatory response within the liver to promote hepatocyte regeneration. These correlative data require confirmation, but are consistent with previous data reporting the existence of redundant adaptive networks within the liver to facilitate the repair response (Michalopoulos, 2010).
In summary, the data suggest that TFP altered APAP toxicity through two possible mechanisms that were independent of metabolism. The findings at early time points in the toxicity (reduction of HIF-1α and toxicity; Figures 1-5) implicate a mechanism involving oxidative stress and MPT. Consistent with our findings, the MPT inhibitor CYC also reduced HIF-α induction in APAP toxicity in the mouse and in freshly isolated hepatocytes (James et al., 2006; Chaudhuri et al., 2010). In addition, TFP reduced PLA2 activity and PGE2 expression, (Fig. 9, 10) responses that likely contributed to the overall effects of TFP on the hepatocyte regeneration response. The current strategy for the treatment of APAP toxicity in the clinical setting is limited to treatment with the antidote N-acetylcysteine, a time-dependent therapy that targets the metabolism effects of APAP. The identification of new mechanisms of APAP toxicity and the testing of therapies that alter these mechanisms has relevance for the development of future novel drugs for the treatment of APAP mediated liver injury.
HIGHLIGHTS.
Trifluoperazine reduced acetaminophen toxicity and lowered HIF-1α induction.
Trifluoperazine had no effect on the metabolism of acetaminophen.
Trifluoperazine reduced hepatocyte regeneration.
Trifluoperazine reduced both phospholipase A2 activity and prostaglandin E2 expression.
Trifluoperazine had dual effects in acetaminophen toxicity.
ABBREVIATIONS
- APAP
acetaminophen
- ALT
alanine aminotransferase
- cPLA2
cytosolic phospholipase A2
- CYC
cyclosporine A
- GSH
glutathione
- HIF-1α
hypoxia inducible factor-1α
- MPT
mitochondrial permeability transition
- PCNA
proliferating cell nuclear antigen
- PGE2
prostaglandin E2
- sPLA2
secretory phospholipase A2
- TFP
trifluoperazine
- TNFα
tumor necrosis factor alpha
- VEGF
vascular endothelial growth factor
Footnotes
This work was supported in part by grants by the National Institutes of Health [Grant DK 75936], the Arkansas Children’s Hospital University Medical Group, and the Arkansas Biosciences Institute.
Publisher's Disclaimer: This is a PDF file of an unedited manuscript that has been accepted for publication. As a service to our customers we are providing this early version of the manuscript. The manuscript will undergo copyediting, typesetting, and review of the resulting proof before it is published in its final citable form. Please note that during the production process errors may be discovered which could affect the content, and all legal disclaimers that apply to the journal pertain.
Contributor Information
Shubhra Chaudhuri, Email: SCHAUDHURI@uams.edu.
Sandra S. McCullough, Email: mcculloughsandras@uams.edu.
Leah Hennings, Email: lhennings@uams.edu.
Aliza T. Brown, Email: brownalizat@uams.edu.
Pippa M. Simpson, Email: psimpson@mcw.edu.
Jack A. Hinson, Email: hinsonjacka@uams.edu.
References
- Bhave VS, Donthamsetty S, Latendresse JR, Cunningham ML, Mehendale HM. Secretory phospholipase A-mediated progression of hepatotoxicity initiated by acetaminophen is exacerbated in the absence of hepatic COX-2. Toxic App Pharm. 2011;251:173–180. doi: 10.1016/j.taap.2011.01.013. [DOI] [PubMed] [Google Scholar]
- Boess F, Bopst M, Althaus R, Polsky S, Cohen SD, Eugster HP, Boelsterli UA. Acetaminophen hepatotoxicity in tumor necrosis factor/lymphotoxin-alpha gene knockout mice. Hepatology. 1998;27:1021–1029. doi: 10.1002/hep.510270418. [DOI] [PubMed] [Google Scholar]
- Broekemeier KM, Pfeiffer DR. Cyclosporin A-sensitive and insensitive mechanisms produce the permeability transition in mitochondria. Biochem Biophys Res Comm. 1989;163:561–566. doi: 10.1016/0006-291x(89)92174-8. [DOI] [PubMed] [Google Scholar]
- Broekemeier KM, Pfeiffer DR. Inhibition of the mitochondrial permeability transition by cyclosporin A during long time frame experiments: relationship between pore opening and the activity of mitochondrial phospholipases. Biochemistr. 1995;34:16440–16449. doi: 10.1021/bi00050a027. [DOI] [PubMed] [Google Scholar]
- Caro AA, Cederbaum AI. Role of phospholipase A2 activation and calcium in CYP2E1-dependent toxicity in HepG2 cells. J Biol Chem. 2003;278:33866–33877. doi: 10.1074/jbc.M300408200. [DOI] [PubMed] [Google Scholar]
- Casado M, Callejas NA, Rodrigo J, Zhao X, Dey SK, Bosca L, Martin-Sanz P. Contribution of cyclooxygenase 2 to liver regeneration after partial hepatectomy. Faseb J. 2001;15:2016–2018. doi: 10.1096/fj.01-0158fje. [DOI] [PubMed] [Google Scholar]
- Castilho RF, Kowaltowski AJ, Meinicke AR, Vercesi AE. Oxidative damage of mitochondria induced by Fe(II)citrate or t-butyl hydroperoxide in the presence of Ca2+: effect of coenzyme Q redox state. Free Rad Biol Med. 1995;18:55–59. doi: 10.1016/0891-5849(94)00098-5. [DOI] [PubMed] [Google Scholar]
- Cavar I, Kelava T, Vukojevic K, Saraga-Babic M, Culo F. The role of prostaglandin E2 in acute hepatotoxicity in mice. Histol Histopathol. 2010;25:819–830. doi: 10.14670/HH-25.819. [DOI] [PubMed] [Google Scholar]
- Chandel NS, McClintock DS, Feliciano CE, Wood TM, Melendez JA, Rodriguez AM, Schumacker PT. Reactive oxygen species generated at mitochondrial complex III stabilize hypoxia-inducible factor-1alpha during hypoxia: a mechanism of O2 sensing. J Biol Chem. 2000;275:25130–25138. doi: 10.1074/jbc.M001914200. [DOI] [PubMed] [Google Scholar]
- Chaudhuri S, McCullough SS, Hennings L, Letzig L, Simpson PM, Hinson JA, James LP. Acetaminophen hepatotoxicity and HIF-1alpha induction in mice occur without hypoxia. Toxic Appl Pharm. 2010;252:211–220. doi: 10.1016/j.taap.2011.02.005. [DOI] [PMC free article] [PubMed] [Google Scholar]
- Cummings BS, McHowat J, Schnellmann RG. Phospholipase A(2)s in cell injury and death. J Pharm Exp Thera. 2000;294:793–799. [PubMed] [Google Scholar]
- Dimova S, Koleva M, Rangelova D, Stoythchev T. Effect of nifedipine, verapamil, diltiazem and trifluoperazine on acetaminophen toxicity in mice. Archives of toxicology. 1995;70:112–118. doi: 10.1007/BF02733671. [DOI] [PubMed] [Google Scholar]
- Donahower B, McCullough SS, Kurten RC, Lamps LW, Simpson PM, Hinson JA, James LP. Vascular Endothelial Growth Factor and Hepatocyte Regeneration in Acetaminophen Toxicity. Amer J Physiol. 2006;291:102–109. doi: 10.1152/ajpgi.00575.2005. [DOI] [PubMed] [Google Scholar]
- Donahower BC, McCullough SS, Hennings L, Simpson PM, Stowe CD, Saad AG, Kurten RC, Hinson JA, James LP. Human recombinant vascular endothelial growth factor reduces necrosis and enhances hepatocyte regeneration in a mouse model of acetaminophen toxicity. J Pharm Exp Thera. 2010;334:33–43. doi: 10.1124/jpet.109.163840. [DOI] [PMC free article] [PubMed] [Google Scholar]
- Elimadi A, Morin D, Sapena R, Chauvet-Monges AM, Crevat A, Tillement JP. Comparison of the effects of cyclosporine A and trimetazidine on Ca(2+)-dependent mitochondrial swelling. Fund Clin Pharm. 1997;11:440–447. doi: 10.1111/j.1472-8206.1997.tb00206.x. [DOI] [PubMed] [Google Scholar]
- Fayard JM, Tessier C, Pageaux JF, Lagarde M, Laugier C. Nuclear location of PLA2-I in proliferative cells. J Cell Sci. 1998;111(Pt 7):985–994. doi: 10.1242/jcs.111.7.985. [DOI] [PubMed] [Google Scholar]
- George RJ, Sturmoski MA, Anant S, Houchen CW. EP4 mediates PGE2 dependent cell survival through the PI3 kinase/AKT pathway. Prosta Lipid Med. 2007;83:112–120. doi: 10.1016/j.prostaglandins.2006.10.005. [DOI] [PMC free article] [PubMed] [Google Scholar]
- Giorgio V, Soriano ME, Basso E, Bisetto E, Lippe G, Forte MA, Bernardi P. Cyclophilin D in mitochondrial pathophysiology. Biochim Et Biophys Acta. 2010;1797:1113–1118. doi: 10.1016/j.bbabio.2009.12.006. [DOI] [PMC free article] [PubMed] [Google Scholar]
- Glaser KB. Regulation of phospholipase A2 enzymes: selective inhibitors and their pharmacological potential. Adv Pharm (San Diego, Calif) 1995;32:31–66. doi: 10.1016/s1054-3589(08)61011-x. [DOI] [PubMed] [Google Scholar]
- Halestrap AP, McStay GP, Clarke SJ. The permeability transition pore complex: another view. Biochimie. 2002;84:153–166. doi: 10.1016/s0300-9084(02)01375-5. [DOI] [PubMed] [Google Scholar]
- Hinson JA, Pike SL, Pumford NR, Mayeux PR. Nitrotyrosine-protein adducts in hepatic centrilobular areas following toxic doses of acetaminophen in mice. Chem Res Tox. 1998;11:604–607. doi: 10.1021/tx9800349. [DOI] [PubMed] [Google Scholar]
- Hitchon C, Wong K, Ma G, Reed J, Lyttle D, El-Gabalawy H. Hypoxia-induced production of stromal cell-derived factor 1 (CXCL12) and vascular endothelial growth factor by synovial fibroblasts. Arth Rheum. 2002;46:2587–2597. doi: 10.1002/art.10520. [DOI] [PubMed] [Google Scholar]
- Ishida Y, Kondo T, Tsuneyama K, Lu P, Takayasu T, Mukaida N. The pathogenic roles of tumor necrosis factor receptor p55 in acetaminophen-induced liver injury in mice. J Leuk Bio. 2004;75:59–67. doi: 10.1189/jlb.0403152. [DOI] [PubMed] [Google Scholar]
- Jaeschke H. Glutathione disulfide formation and oxidant stress during acetaminophen-induced hepatotoxicity in mice in vivo: the protective effect of allopurinol. J Pharm Exp Thera. 1990;255:935–941. [PubMed] [Google Scholar]
- James LP, Donahower B, Burke AS, McCullough S, Hinson JA. Induction of the nuclear factor HIF-1alpha in acetaminophen toxicity: evidence for oxidative stress. Biochem Biophys Res Comm. 2006;343:171–176. doi: 10.1016/j.bbrc.2006.02.143. [DOI] [PubMed] [Google Scholar]
- James LP, Kurten RC, Lamps LW, McCullough S, Hinson JA. Tumour necrosis factor receptor 1 and hepatocyte regeneration in acetaminophen toxicity: a kinetic study of proliferating cell nuclear antigen and cytokine expression. Basic Clin Pharm Tox. 2005;97:8–14. doi: 10.1111/j.1742-7843.2005.pto_97102.x. [DOI] [PubMed] [Google Scholar]
- Jollow DJ, Mitchell JR, Potter WZ, Davis DC, Gillette JR, Brodie BB. Acetaminophen-induced hepatic necrosis. II Role of covalent binding in vivo. J Pharm Exp Thera. 1973;187:195–202. [PubMed] [Google Scholar]
- Kato T, Ito Y, Hosono K, Suzuki T, Tamaki H, Minamino T, Kato S, Sakagami H, Shibuya M, Majima M. Vascular endothelial growth factor receptor-1 signaling promotes liver repair through restoration of liver microvasculature after acetaminophen hepatotoxicity. Toxicol Sci. 2011;120:218–229. doi: 10.1093/toxsci/kfq366. [DOI] [PubMed] [Google Scholar]
- Knight TR, Kurtz A, Bajt ML, Hinson JA, Jaeschke H. Vascular and hepatocellular peroxynitrite formation during acetaminophen toxicity: role of mitochondrial oxidant stress. Toxicol Sci. 2001;62:212–220. doi: 10.1093/toxsci/62.2.212. [DOI] [PubMed] [Google Scholar]
- Kon K, Kim JS, Jaeschke H, Lemasters JJ. Mitochondrial permeability transition in acetaminophen-induced necrosis and apoptosis of cultured mouse hepatocytes. Hepatology (Baltimore, Md) 2004;40:1170–1179. doi: 10.1002/hep.20437. [DOI] [PubMed] [Google Scholar]
- Kotch LE, Iyer NV, Laughner E, Semenza GL. Defective vascularization of HIF-1alpha-null embryos is not associated with VEGF deficiency but with mesenchymal cell death. Dev Biol. 1999;209:254–267. doi: 10.1006/dbio.1999.9253. [DOI] [PubMed] [Google Scholar]
- Larson AM, Polson J, Fontana RJ, Davern TJ, Lalani E, Hynan LS, Reisch JS, Schiodt FV, Ostapowicz G, Shakil AO, Lee WM. Acetaminophen-induced acute liver failure: results of a United States multicenter, prospective study. Hepatology (Baltimore, Md) 2005;42:1364–1372. doi: 10.1002/hep.20948. [DOI] [PubMed] [Google Scholar]
- Laskin DL, Heck DE, Gardner CR, Feder LS, Laskin JD. Distinct patterns of nitric oxide production in hepatic macrophages and endothelial cells following acute exposure of rats to endotoxin. J Leuk Biol. 1994;56:751–758. doi: 10.1002/jlb.56.6.751. [DOI] [PubMed] [Google Scholar]
- Lemasters JJ. V. Necrapoptosis and the mitochondrial permeability transition: shared pathways to necrosis and apoptosis. Amer J Phys. 1999;276:G1–6. doi: 10.1152/ajpgi.1999.276.1.G1. [DOI] [PubMed] [Google Scholar]
- Lemasters JJ, Nieminen AL, Qian T, Trost LC, Elmore SP, Nishimura Y, Crowe RA, Cascio WE, Bradham CA, Brenner DA, Herman B. The mitochondrial permeability transition in cell death: a common mechanism in necrosis, apoptosis and autophagy. Biochim Biophys Acta. 1998;1366:177–196. doi: 10.1016/s0005-2728(98)00112-1. [DOI] [PubMed] [Google Scholar]
- Lemasters JJ, Qian T, Bradham CA, Brenner DA, Cascio WE, Trost LC, Nishimura Y, Nieminen AL, Herman B. Mitochondrial dysfunction in the pathogenesis of necrotic and apoptotic cell death. J Bioenerg Biomembr. 1999;31:305–319. doi: 10.1023/a:1005419617371. [DOI] [PubMed] [Google Scholar]
- Michalopoulos GK. Liver regeneration after partial hepatectomy: critical analysis of mechanistic dilemmas. Amer J Path. 2010;176:2–13. doi: 10.2353/ajpath.2010.090675. [DOI] [PMC free article] [PubMed] [Google Scholar]
- Micheli-Halle A. Echinomycin decreases induction of vascular endothelial growth factor and hepatocyte regeneration in acetaminophen toxicity in mice. BCBT. 2011 doi: 10.1111/j.1742-7843.2011.00812.x. in press. [DOI] [PMC free article] [PubMed] [Google Scholar]
- Mitchell JR, Jollow DJ, Potter WZ, Gillette JR, Brodie BB. Acetaminophen-induced hepatic necrosis. IV. Protective role of glutathione. J Pharm Exp Ther. 1973;187:211–217. [PubMed] [Google Scholar]
- Muldrew KL, James LP, Coop L, McCullough SS, Hendrickson HP, Hinson JA, Mayeux PR. Determination of acetaminophen-protein adducts in mouse liver and serum and human serum after hepatotoxic doses of acetaminophen using high- performance liquid chromatography with electrochemical detection. Drug metabolism and disposition: the biological fate of chemicals. 2002;30:446–451. doi: 10.1124/dmd.30.4.446. [DOI] [PubMed] [Google Scholar]
- North TE, Babu IR, Vedder LM, Lord AM, Wishnok JS, Tannenbaum SR, Zon LI, Goessling W. PGE2-regulated wnt signaling and N-acetylcysteine are synergistically hepatoprotective in zebrafish acetaminophen injury. Proc Nat Acad Sci. 2010;107:17315–17320. doi: 10.1073/pnas.1008209107. [DOI] [PMC free article] [PubMed] [Google Scholar]
- Rehman H, Sun J, Shi Y, Ramshesh VK, Liu Q, Currin RT, Lemasters JJ, Zhong Z. NIM811 prevents mitochondrial dysfunction, attenuates liver injury, and stimulates liver regeneration after massive hepatectomy. Transplantation. 2011;91:406–412. doi: 10.1097/TP.0b013e318204bdb2. [DOI] [PMC free article] [PubMed] [Google Scholar]
- Reid AB, Kurten RC, McCullough SS, Brock RW, Hinson JA. Mechanisms of acetaminophen-induced hepatotoxicity: role of oxidative stress and mitochondrial permeability transition in freshly isolated mouse hepatocytes. J Pharm Exp Ther. 2005;312:509–516. doi: 10.1124/jpet.104.075945. [DOI] [PubMed] [Google Scholar]
- Reilly TP, Brady JN, Marchick MR, Bourdi M, George JW, Radonovich MF, Pise-Masison CA, Pohl LR. A protective role for cyclooxygenase-2 in drug-induced liver injury in mice. Chem Res Tox. 2001;14:1620–1628. doi: 10.1021/tx0155505. [DOI] [PubMed] [Google Scholar]
- Reyes YAB, Shimoyama T, Akamatsu H, Sunamori M. MCI-186 (edaravone), a free radical scavenger, attenuates ischemia-reperfusion injury and activation of phospholipase A2 in an isolated rat lung model after 18 h of cold preservation. Eur J Card Surg. 2006;29:304–311. doi: 10.1016/j.ejcts.2005.12.005. [DOI] [PubMed] [Google Scholar]
- Salazard B, Bellon L, Jean S, Maraninchi M, El-Yazidi C, Orsiere T, Margotat A, Botta A, Berge-Lefranc JL. Low-level arsenite activates the transcription of genes involved in adipose differentiation. Cell Bio Tox. 2004;20:375–385. doi: 10.1007/s10565-004-1471-1. [DOI] [PubMed] [Google Scholar]
- Schoen Smith JM, Lautt WW. The role of prostaglandins in triggering the liver regeneration cascade. Nitric Oxide. 2005;13:111–117. doi: 10.1016/j.niox.2005.05.006. [DOI] [PMC free article] [PubMed] [Google Scholar]
- Semenza GL. Hypoxia-inducible factor 1: master regulator of O2 homeostasis. Curr Opin Gen Dev. 1998;8:588–594. doi: 10.1016/s0959-437x(98)80016-6. [DOI] [PubMed] [Google Scholar]
- Sparkenbaugh EM, Saini Y, Greenwood KK, Lapres JJ, Luyendyk JP, Copple BL, Maddox JF, Ganey PE, Roth RA. The Role of Hypoxia-Inducible Factor-1{alpha} in Acetaminophen Hepatotoxicity. J Pharm Exp Ther. 2011;338:492–502. doi: 10.1124/jpet.111.180521. [DOI] [PMC free article] [PubMed] [Google Scholar]
- Umegaki T, Okimura Y, Fujita H, Yano H, Akiyama J, Inoue M, Utsumi K, Sasaki J. Flow cytometric analysis of ca-induced membrane permeability transition of isolated rat liver mitochondria. J Clin Biochem Nutr. 2008;42:35–44. doi: 10.3164/jcbn.2008006. [DOI] [PMC free article] [PubMed] [Google Scholar]
- Ushio A, Takikawa Y, Lin SD, Miyamoto Y, Suzuki K. Induction of Bcl-xL is a possible mechanism of anti-apoptotic effect by prostaglandin E2 EP4-receptor agonist in human hepatocellular carcinoma HepG2 cells. Hepatol Res. 2004;29:173–179. doi: 10.1016/j.hepres.2004.03.001. [DOI] [PubMed] [Google Scholar]
- Yamamoto H. Antagonism of acetaminophen-induced hepatocellular destruction by trifluoperazine in mice. Pharm Tox. 1990;67:115–119. doi: 10.1111/j.1600-0773.1990.tb00795.x. [DOI] [PubMed] [Google Scholar]


