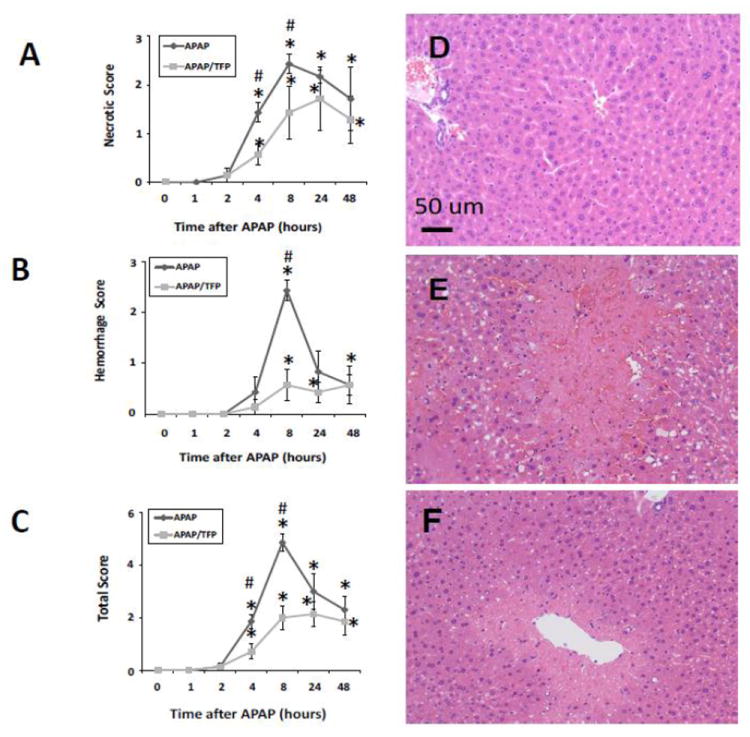
Fig. 3.

Histologic scoring for (A) necrosis, (B) hemorrhage, and (C) combined parameters in saline, APAP and APAP/TFP mice over time. Liver sections were scored by a blinded reviewer. *represents comparison to saline; #represents comparison to APAP (p<0.05). (D) representative saline mouse, (E) representative APAP mouse at 8 h showing extensive necrosis and hemorrhage, (F) representative APAP/TFP mouse at 8 h showing reduced necrosis and hemorrhage.
