
Fig. 3.
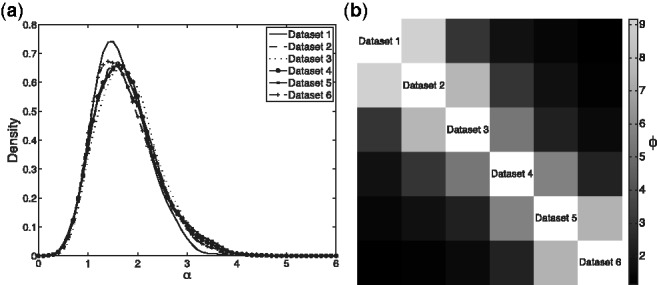
(a) Densities fitted to the sampled values of  . (b) Heatmap representation of the matrix with
  -entry
  , the posterior mean value for
Official websites use .gov
A
.gov website belongs to an official
government organization in the United States.
Secure .gov websites use HTTPS
A lock (
) or https:// means you've safely
connected to the .gov website. Share sensitive
information only on official, secure websites.
(a) Densities fitted to the sampled values of . (b) Heatmap representation of the matrix with -entry , the posterior mean value for