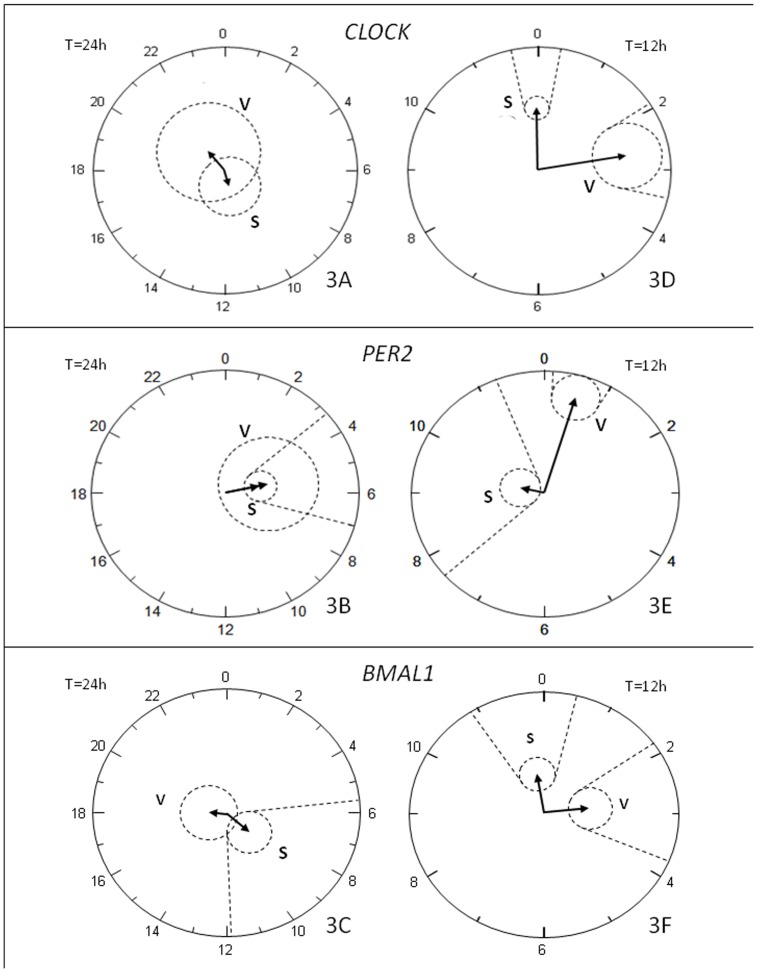
Figure 3. Polar (clock-like) representation of the estimates of the parameters of the rhythm for CLOCK, PER2 and BMAL1 in dexamethasone treated groups.
In graphs 3A, 3B and 3C the circles represent 24 hours while in 3D, 3E and 3F it represents 12 hours, and the radius corresponds to 5 units. The vector length is the amplitude of the rhythm and it points to its acrophase. Dotted circles are the join 95% confidence limits for the vectors (if limits include the centre, the rhythm is not statistically significant), and dotted lines are the corresponding confidence interval for the acrophase. In 3A, 3B and 3C the absence of 24 hours rhythmicity is evident except for the subcutaneous PER2 and BMAL1 that is statistically significant. In 3D, 3E and 3F the presence of an approximately 12 hours oscillation is evidenced in all treated groups.

