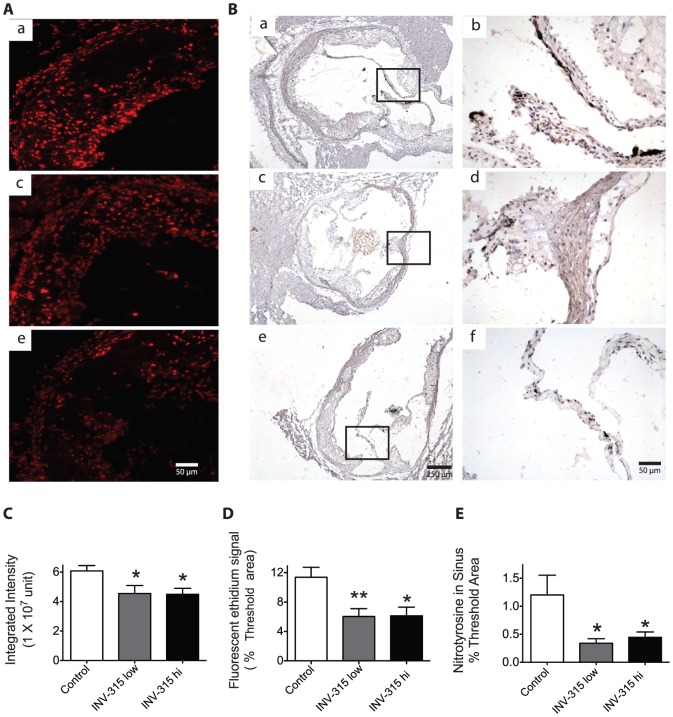
Figure 3. Effects of MPO inhibition on superoxide and nitrotyrosine within the mice sinus of HFD-fed mice.
A. Fluorescent photomicrographs at identical settings of sections of sinus labeled with dihydroethidium [1] at 200× magnification. a, control mice treated with placebo; b, mice treated with INV-315 at low dose; c, mice treated with INV-315 at high dose. B, Representative images of immunohistochemistry for nitrotyrosine in the sinus. a and b, control mice treated with placebo; c and d, mice treated with INV-315 at low dose; e and f, mice treated with INV-315 at high dose. b, d and f in the right panel are higher magnifications of a, c and e in the left panel respectively. C and D. Quantification of the fluorescent ethidium signal in the sinus by integrated intensity (C) and % threshold area (D). E. Statistical analysis of immunohistochemistry for nitrotyrosine in the sinus. *P<0.05, **P<0.01 compared with control group. Data are mean± S.E.M. of 7–9 experiments from different mice.

