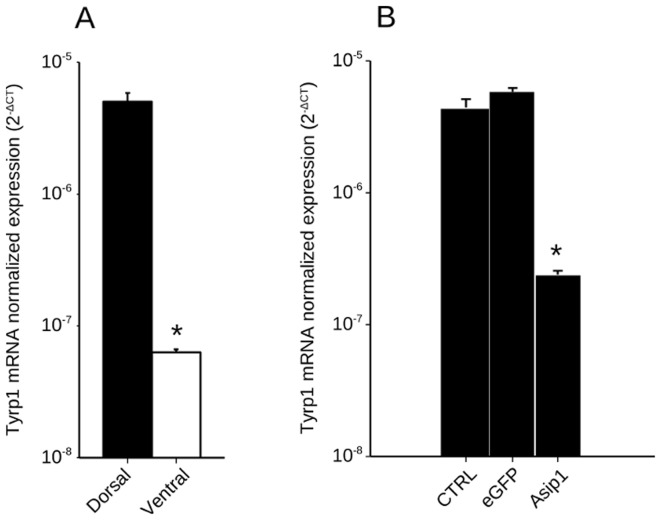
Figure 9. Normalized gene expression levels of tyrosinase-related protein 1 (Tyrp1) in turbot skin.
(A) Analysis of differential dorsal-ventral Tyrp1 gene expression in turbot. (B) Effect of the in vivo injection of capped mRNA on Tyrp1 expression. Shown are log10 transformed ΔCt values of Tyrp1 relative to β-actin. Data are the mean ± SD from four samples after triplicate PCR analysis. Comparisons of numerical data were made by paired Student t-tests. Asterisk indicate significant differences (P<0.05) between dorsal and ventral Tyrp1 expression (A) and between control non-treated (CTRL) and eGFP capped mRNA injected skin Tyrp1 expression (B).

