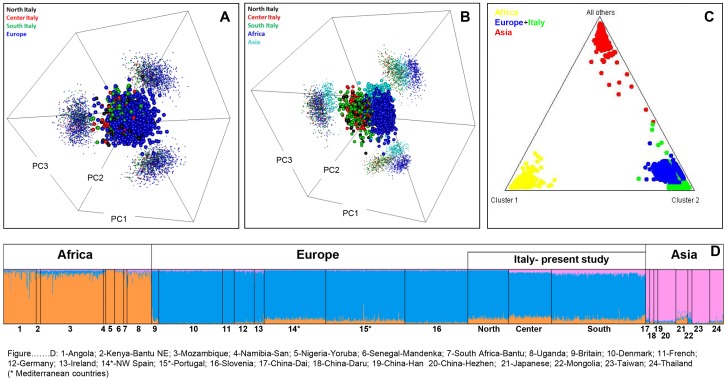
Figure 2. Analysis of AIMs in Italian populations versus other continental population groups.
(A) PCA of Italian populations divided into the main regions North, Center and South (as analyzed in the present study) and other European populations; (B) the same Italian populations plus sub-Saharan African, and Asian populations; (C) triangle plot as obtained using STRUCTURE analysis of Italian, European, sub-Saharan, and Asian populations; (D) bar plot of ancestral membership values as obtained using STRUCTURE analysis of the same populations used in (C). Population codes: 1: Angola; 2: Kenya-Bantu NE; 3: Mozambique; 4: Namibia-San; 5: Nigeria-Yoruba; 6: Senegal-Mandenka; 7: South Africa-Bantu; 8: Uganda; 9: Britain; 10: Denmark; 11: French; 12: Germany; 13: Ireland; 14*: NW Spain; 15*: Portugal; 16: Slovenia; 17: China-Dai; 18: China-Daru; 19: China-Han; 20: China-Hezhen; 21: Japanese; 22: Mongolia; 23: Taiwan; 24: Thailand. Genotypes were downloaded using the method in [43], [83] and belong to the CEPH panel. An asterisk indicates Mediterranean populations.

