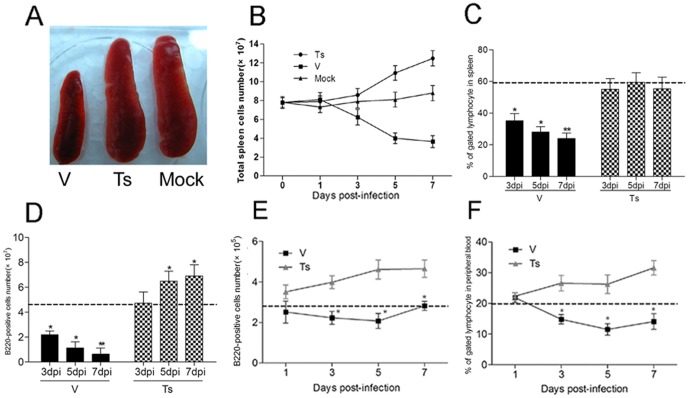
Figure 1. The infection with V led to the atrophy of spleen and the reduced B220+ B cells in spleen, MLN and peripheral blood.
Following infection with V and Ts, the spleen (A), MLN and blood from three mice per group per time point were collected, and the numbers of spleen cells (B) were calculated the percent of B220+ B cells were analyzed by flow cytometry. The proportion (C) and amount (D) of B220+ B cells in spleen were analyzed on day 3, 5 and 7 post-infection. The amount of B220+ B cells in MLN (E) and proportion in peripheral blood; (F) were analyzed on day 1, 3, 5 and 7 post-infection. Baseline from PBS inoculated mice (n = 5) is shown as a dashed line in each graph. The numbers of B220+ B cells in spleen and MLN were calculated by multiplying the percentage of each cell type by the total number of their viable cells. The data shown represents mean ± SD for three independent experiments. * p<0.05 and ** p<0.01 between V and Ts.

