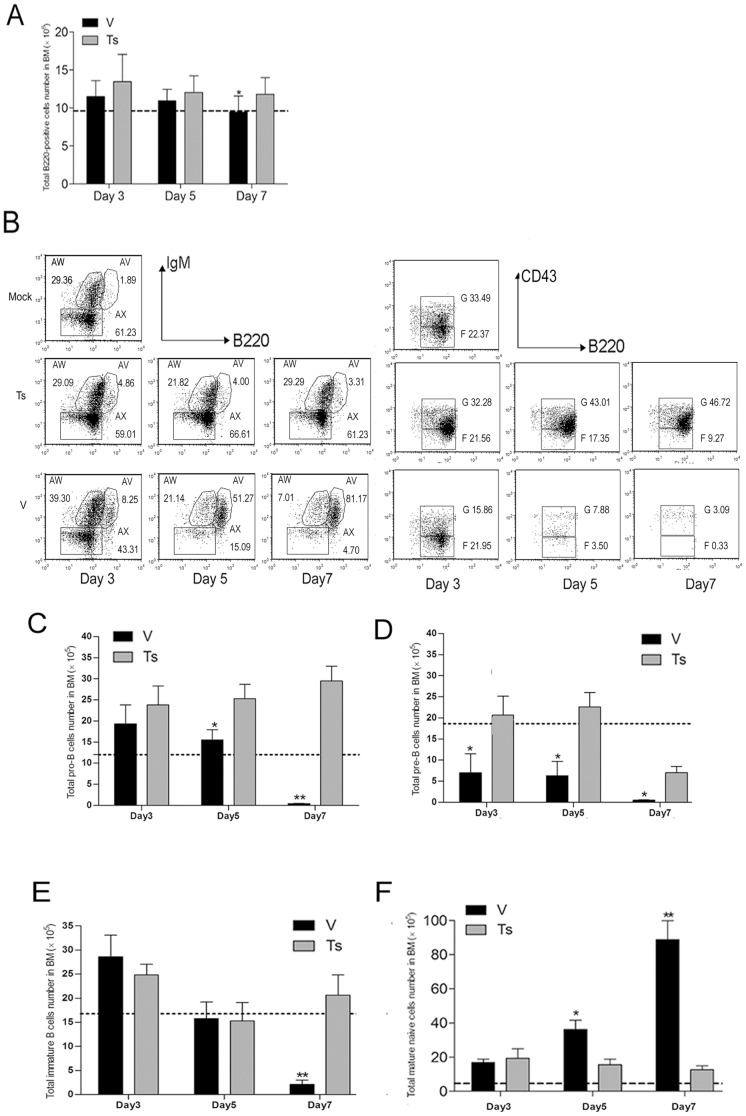
Figure 3. Alternation of BM B cells populations following virus infection.
Following infected with V and Ts virus, the BM cells from three mice per group per time point was prepared on day 3, 5 and 7 post-infection and the phenotypic FACS analysis of B220, IgM, IgD, CD43 expressions within BM cells was performed. (A) The numbers of B220+ cells within BM; (B) the percentages of BM B lineage cells within B220 gated cells populations. B220lowIgM− cells define pro-B (B220+CD43high) and pre-B (B220+CD43low/−) cells, B220lowIgM+cells are immature B cells and B220highIgM+ cells are mainly mature naive recirculating B cells. Percentages shown are calculated from total B220+ cells (erythrocyte-depleted). The numbers of pro- (C), pre- (D), immature B cells (E) and mature naïve B cells (F) were calculated by multiplying the percentage of each cell type by the total number of BM viable cells. Data shown in graph A, C, D, E, F represents mean ± SD for three independent experiments. Data shown in graph B are two-color dot plots from individual mouse, but are representative of three independent experiments. * p<0.05 and ** p<0.01 between V and Ts.

