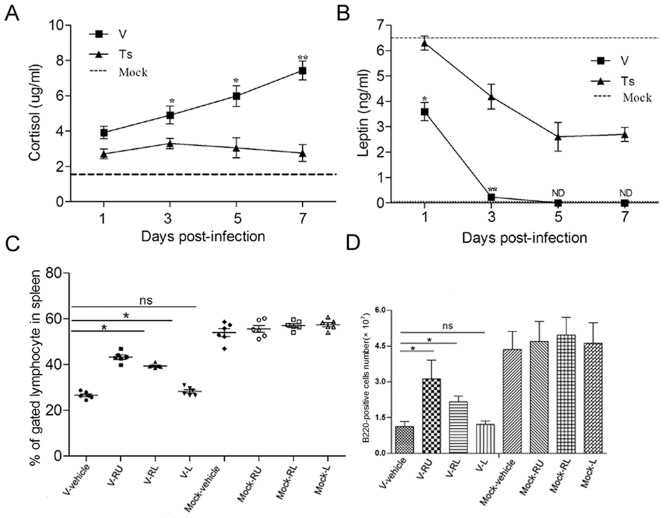
Figure 5. Role of GCs and leptin in depletion of spleen B cells.
(A–B) Following infected with V and Ts virus, plasma from mice was prepared at different time points. Cortisol and leptin levels in plasma were measured using ELISA. Baseline from PBS inoculated mice (n = 5) is shown as a dashed line in each graph. ND means the examination is lower than the limit of detection. Data represent means of three mice per group per time point ± SD. *p<0.05 and **p<0.01 between V and Ts. (C–D) The mice were divided for four groups (12 mice/group) and inoculated i.p. respectively with 2% ethyl alcohol (vehicle), RU486 (R), RU486 plus leptin (RL), leptin (L) from day −1 p.i. and until the end of experiment. Each group was divided for two groups (6 mice/group) again, and one group was infected i.n. with 104 PFU of V (V-) and another was infected i.n. with PBS (Mock-). The spleen cells were prepared on day 5 post-infection and stained. The percentages (C) each group were evaluated by flow cytometry, and the numbers (D) were calculated by multiplying the percentage of each cell type by the total number of spleen viable cells. Data shown in C and D represent means of 6 mice from each group ± SD. Ns mean no statistical difference between both. *p<0.05 and **p<0.01 between V-vehicle and V-R or V-RL or V-L.

