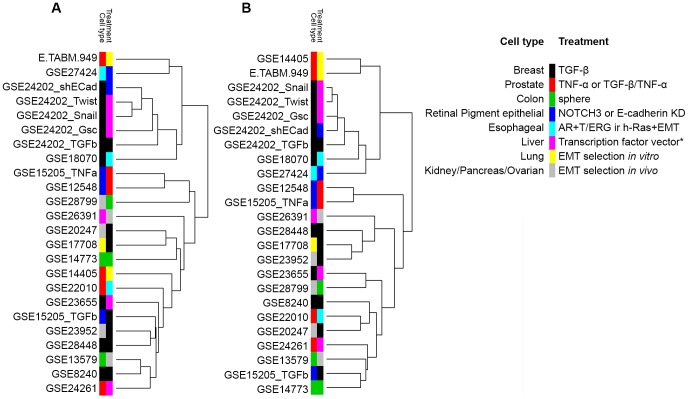
Figure 2. Gene expression studies cluster according to the mode of EMT initiation rather than to cell type.
The cell type and treatment modality of EMT was annotated and revealed clustering according to the mode of EMT induction. The clustering persisted when genes shared between at least 14 GES datasets were used for the analysis. (A) Hierarchical clustering of 365 genes shared between at least 10 datasets. (B) Hierarchical clustering of 41 genes shared between at least 14 datasets. The legend indicates cell type and treatment modality (right panel). *, Transcription factor vectors: Runx2, Six1, Snail, Twist and Goosecoid. GSE: Gene expression omnibus (GEO) series record; E.TABM: ArrayExpress (AE) series record; TGF, transforming growth factor; TNF, tumor necrosis factor.

