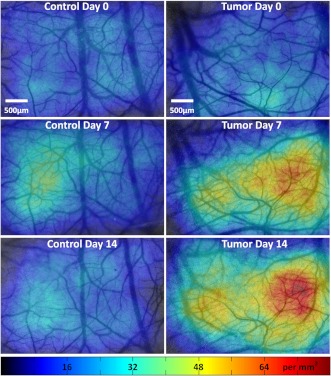
Fig. 5.
Spatiotemporal comparison of MVD values in tumor-bearing and control rats. The images show continuous MVD maps overlaid on the cerebral vasculature of an animal from the unperturbed control group (left panel) and the tumor-bearing group (right panel) on days 0, 7, and 14 after baseline imaging and/or tumor injection. All images are scaled to the same color map (as indicated). The change in MVD over time in the control animal is small, whereas a steep increase in MVD is observed in the tumor-bearing animal.

