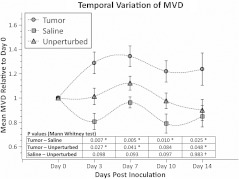
Fig. 6.
Longitudinal variation of MVD over the course of tumor growth. Three groups—tumor (), saline controls (), and unperturbed controls ()—were monitored using LSCI over two weeks since the day of inoculation (day 0). The plot shows means and standard error bars of the MVD averaged over the ROI and normalized to its corresponding baseline MVD value on day 0. The inset table shows results ( value) of a Mann Whitney U test performed to compare the three experimental groups pairwise. The asterisk indicates statistical significance () between groups. The dagger indicates that the day 14 MVD of the saline and unperturbed groups belong to the same distribution.

