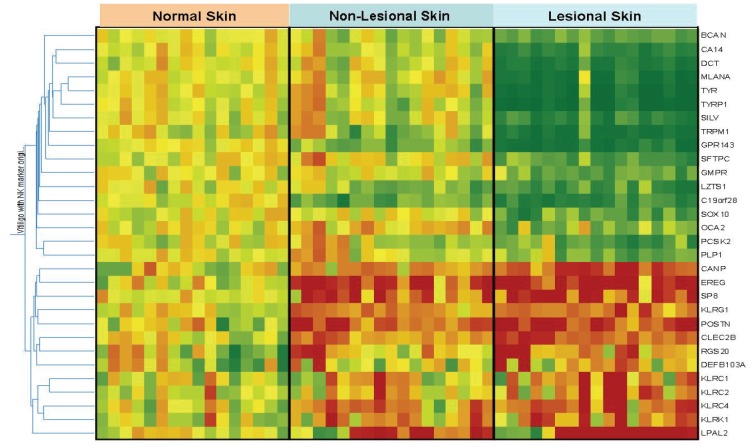
Figure 1. Transcriptome Analysis of Vitiligo and Normal Skin Biopsies.
A heat map is constructed by Gene Spring software (see methods) comparing the relative expression levels of the 30 significantly altered genes in vitiligo skin. Depicted are the expression levels of these genes in individual samples relative to their corresponding expression reference levels, which are the averages of expression in the 16 normal skin biopsies. Red squares: Genes with up-regulation in that sample compared with normal skin of healthy volunteers. Green squares: Genes with down-regulation in that specific sample compared with normal skin of healthy volunteers. Yellow squares: no significant change between the sample and the normal skin of healthy volunteers.

