
Figure 1. Differential effect of ghrelin on food intake and GH secretion in high and low-responders.
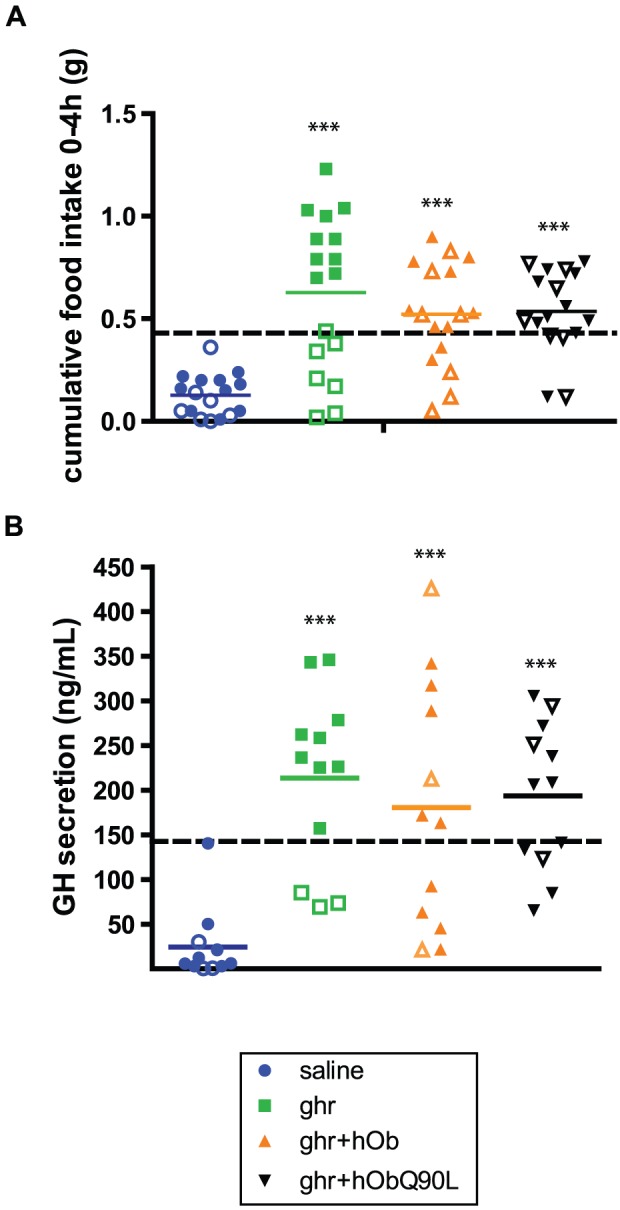
(A) Cumulative 0–4 h food intake and (B) GH peak of secretion in individual mice injected i.p with saline (circles), 30 nmol of ghr (squares), ghr+hOb (triangles) or ghr+hObQ90L (inverted triangles) (30 nmol). 4 hours after ghrelin injection, 59% of mice increased their food consumption over a threshold of 0.42 g (high responders, closed symbols) whereas 41% of mice did not (low responders, open symbols) responders. The dotted line represents the threshold for ghrelin response. Bar represents mean of data. ***P<0.0001 vs saline.