
Figure 3. Effect of native (hOb) and Q90L obestatin (hObQ90L) on ghrelin-induced (Ghr) GH secretion in high responders C57BL/6 mice.
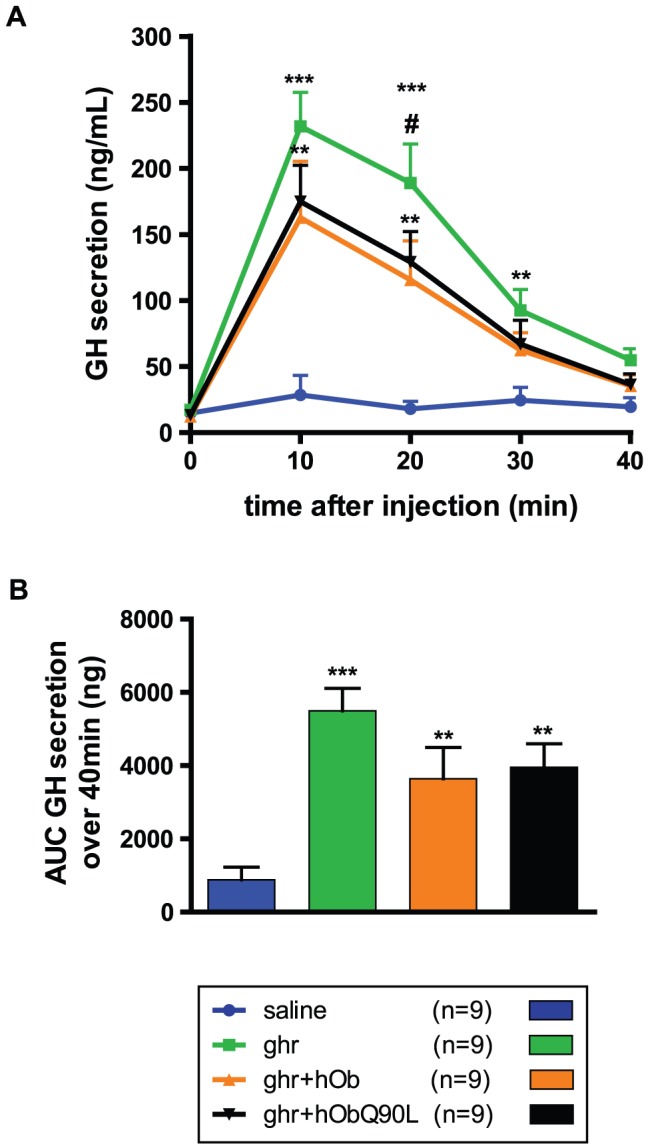
(A) Mean GH secretion in response to the different treatments in high responders. (B) Area Under the curve of GH secretion over 40 minutes in high responders. Data represent mean±SEM. **P<0.01 vs saline, ***P<0.001 vs saline, #P<0.05 vs ghr+hOb.