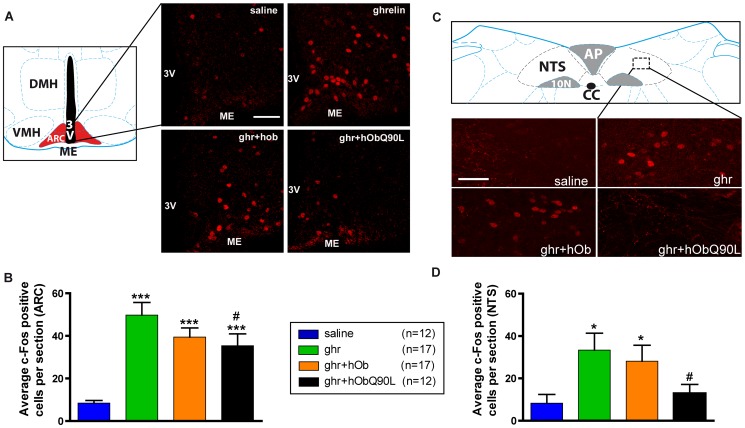
Figure 4. Effect of native (h/rOb) and Q90L obestatin (hObQ90L) on ghrelin-induced (Ghr) cFos immunoreactivity in C57BL/6 mice in the arcuate nucleus (ARC) and in the nucleus tractus solitarius (NTS).
(A and C) Representative confocal photomicrophotographs of the cFos staining after each treatment in coronal sections at 1.9 mm of the interaural line in the ARC and −3.78 mm of the interaural line in the NTS ; (B and D) Average of cFos-positive nuclei per section after the different treatments between 2.2/1.6 mm of the interaural line for the ARC and between −3.78/−3.98 mm of the interaural line for the NTS. Data represent mean±SEM. ***P<0.001 vs saline, *P<0.05 vs saline, #P<0.05 vs ghr. Scale bar represents 100 µm in the ARC and 50 µm in the NTS. 3V: third ventricle, ME: median eminence, DMH: Dorsomedial Hypothalamic nucleus, VMH: Ventromedial Hypothalamic nucleus, ARC: Arcuate nucleus, NTS: Nucleus Tractus Solitarius, AP: Area Postrema, 10N: Dorsal Motor Nucleus of Vagus, cc: central canal.

