
Figure 6. Effect of native (hOb) and Q90L obestatin (hObQ90L) on the ghrelin-induced (Ghr) decrease of evoked GABA synaptic responses in GHRH neurons.
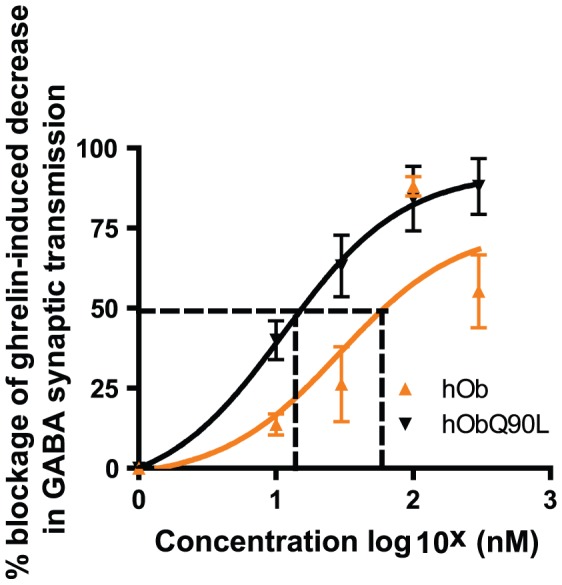
Dose response curves for hOb and hObQ90L (10, 30, 100 and 300 nM) represented on a semi-logarithmic scale. Ghrelin was applied at 300 nM. Data represent mean±SEM. The dotted line represents the EC50 values, 18 µM and 66.4 µM for hObQ90L and hOBhOb respectively. The two curves show significant differences (comparing best fit values of two groups using Student T-test, P<0.001).