Figure 3.
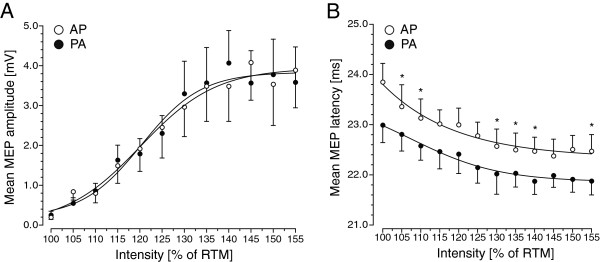
Stimulus–response curves (SRCs) of the relaxed left APB muscle using a stimulus intensity referenced to individual resting motor threshold (RMT) for AP and PA half-sine stimulation (Experiment 3, n = 8). SRCs of the relaxed left APB muscle in RMT indicate changes in mean MEP amplitude (panel A) or mean MEP latency (panel B) with increasing intensity of half-sine wave TMS. For the SRCs, the increase in stimulus intensity was individually adjusted to the respective RMT intensity for AP and PA stimulation (SRCRMT) to control for direction-specific differences in RMT. Filled circles refer to the mean MEP amplitude or latency evoked by a half-sine wave stimulus producing a PA current, whereas open circles refer to the mean MEP amplitude or latency evoked by a half-sine wave stimulus inducing an AP current in right M1-HAND. Error bars represent standard error of the mean. Asterisks indicate significant differences (paired t-test, Bonferroni corrected).

