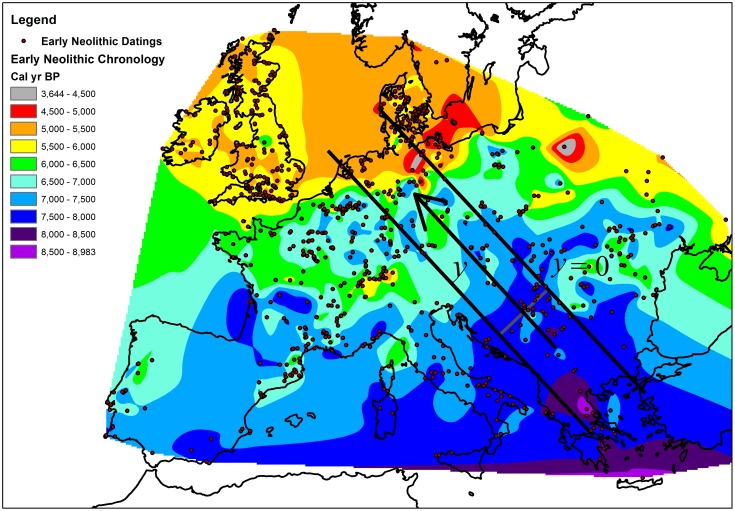
Figure 1. Chronology of arrival times of the Neolithic transition in Europe.
The circles correspond to the 902 datings (included as Table S1) used for this natural neighbor interpolation. The delimited corridor defines the region studied here, where the Neolithic expansion took place mainly in the  direction. The origin of the
  coordinate is also defined on the map.

