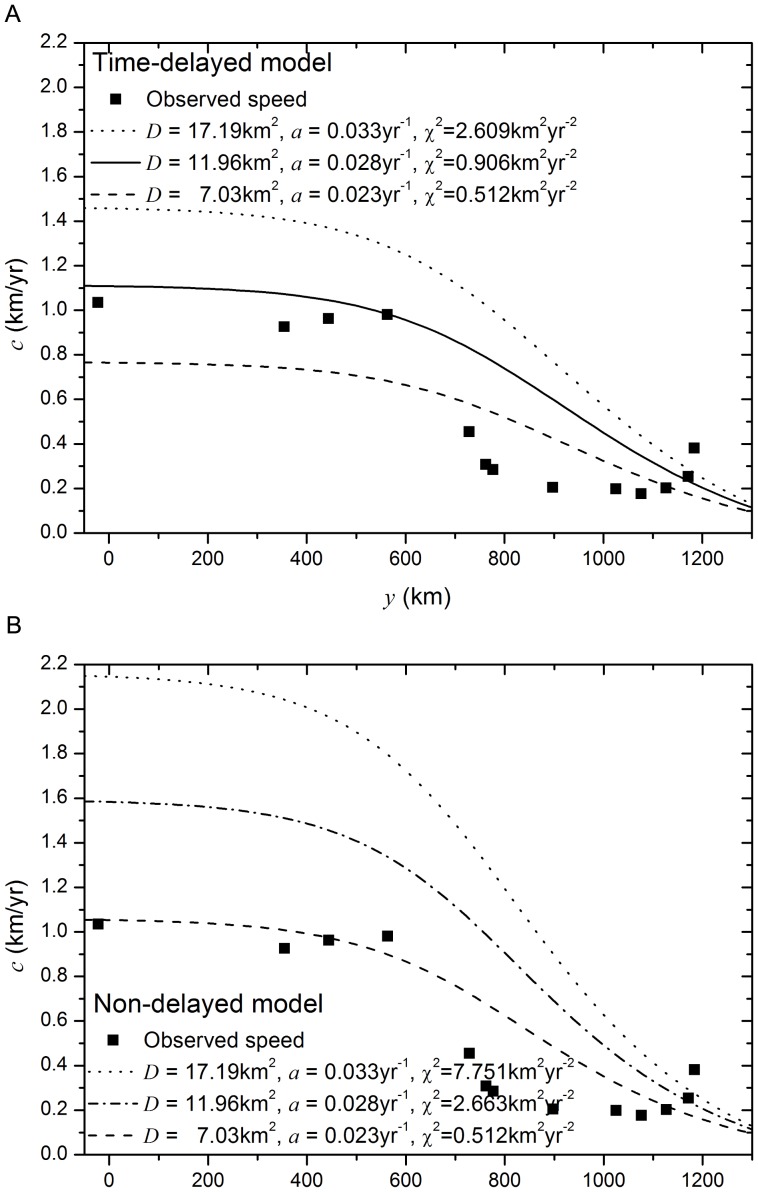
Figure 3. Parameter sensitivity of the models.
Symbols (squares): Measured front speed from archaeological data. Lines: Upper and lower error bands (dotted and dashed lines respectively) predicted when considering the  C.L. intervals for
  and
and  for (a) the time-delayed model and (b) the non-delayed model. The solid line in (a) and the dash-dotted line in (b) correspond to the mean prediction, i.e., they are the same as in Fig. 2b. (
 ,
,  and
and  ).
).

