Figure 1.
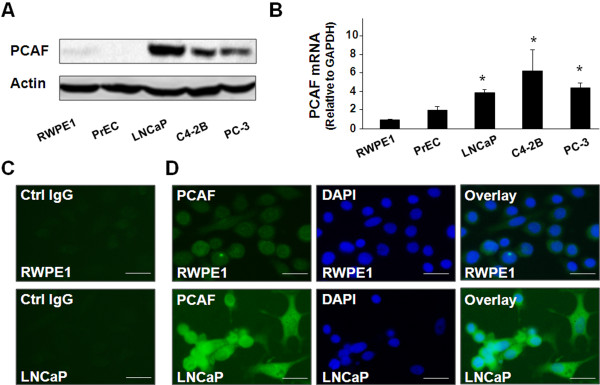
Expression of PCAF in cultured cell lines. A and B, expression of PCAF as assessed by Western blot and qRT-PCR, respectively. Representative Western blots are shown in A; β-actin was also blotted to ensure equal loading. The amount of PCAF mRNA is shown in B. Data in B are averages of three independent experiments. *, p < 0.05 compared to RWPE1 and PrEC cells. C and D, expression of PCAF protein in RWPE1 and LNCaP cells as assessed by immunofluorescent staining. PCAF was stained in green using a specific anti-PCAF antibody (in D). Cell nuclei were stained in blue with DAPI and overlaid images were also shown. The non-specific IgG was used as the control (as shown in C). Bar = 10 μm.

