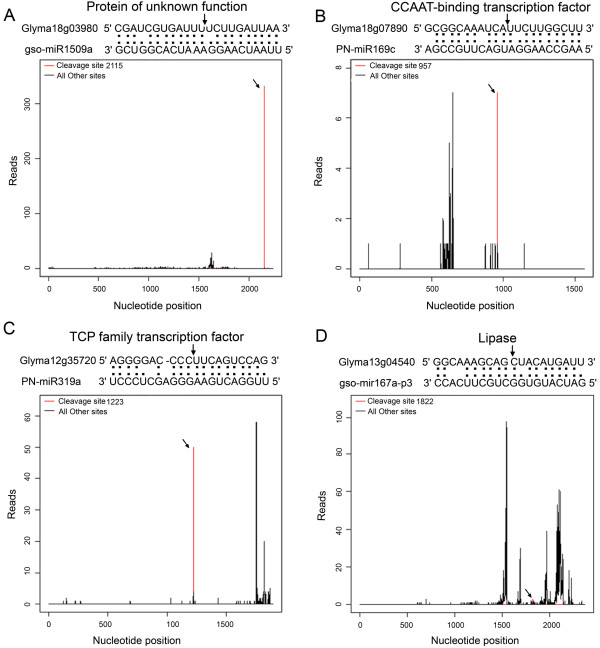
Figure 4.
T-plots of miRNA targets in the four different categories. The T-plots show the distribution of the degradome tags along the full-length of the target mRNA sequence (bottom). The red line represents the sliced target transcripts and is shown by an arrow. The alignments show the miRNA with a portion of its target sequence (top). Two dots indicate matched RNA base pairs; one dot indicates a GU mismatch. The arrow shows the cleavage site. (A) Example of the category I target Glyma18g03980 for gso-miR1509a. (B) Example of the category II target Glyma18g07890 for PN-miR169c. (C) Example of the category III target Glyma12g35720 for PN-miR319a. (D) Example of the category IV target Glyma13g04540 for gso-mir167a-p3. The categories were based on the relative abundance of the tags at the target sites.

