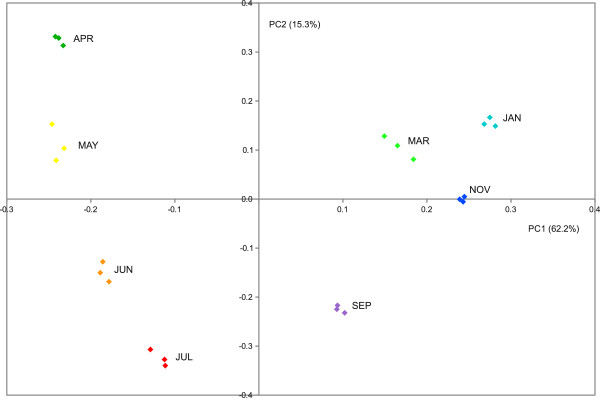
Figure 2.
Bi-dimensional loading score plot of sample replicates resulting from PCA analysis. X axis represents PC1 that explains 62.2% and Y axis represents PC2 that explains 15.3% of the total variability for gene expression. Samples belonging to the same time-point are represented by the same color.

