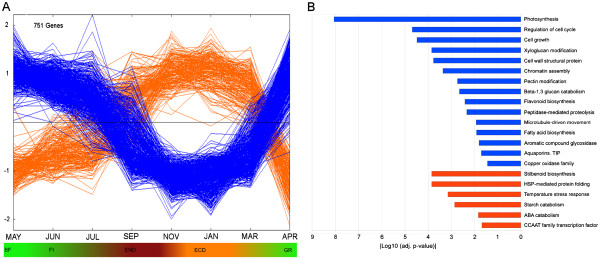
Figure 3.
Top-scored transcripts for Principal Component 1.A) Expression profiles of the transcripts with positive component score values (orange lines) and negative component score values (blue lines). Each single line represents the average of mean-centered expression values for an individual transcript. B) Functional categories over-represented in each cluster. Color code is the same as in A. Absolute values of the log10 transformed P-values were used for the bar diagram representing statistical signification, only categories with P-values < 0.05 were shown. BF, bud formation; FI, flowering induction; END, endodormancy; ECD, ecodormancy; GR, growth resumption.

