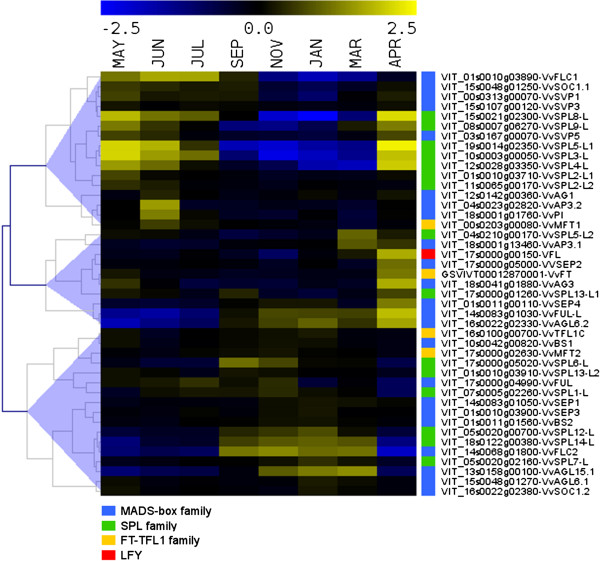
Figure 6.
Hierarchical clustering of expression profiles of key regulators of reproductive development along bud development. MADS-box gene family (blue boxes), SPL gene family (green boxes), FT-TFL1 gene family (orange boxes) and the VFL gene (red box). Color scale (on top) represents mean-centered expression values.

