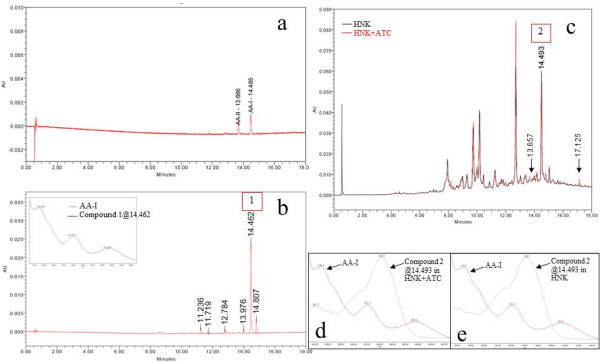
Figure 1.

HPLC chromatograms and UV spectra of AA standard and herbal samples. HPLC chromatograms of (a) standard mixture of AA-I and AA-II (b) ATC and UV spectra (c) overlaid HNK+ATC and HNK (d) overlaid UV spectra of the peak at RT 14.510 in HNK+ATC and AA-I and (e) overlaid UV spectra of the peak at RT 14.510 in HNK and AA-I.
