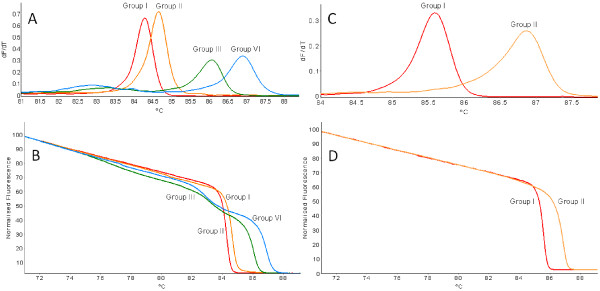
Figure 3.
High-resolution melting curve analysis using variant-specific plasmid DNA in real-time PCR HRM assays. Derivative HRM curves (dF/dT) (A and C) and normalized HRM curves (B and D) obtained using SYTO 9 for the detection of GLRaV-3 variants. Primer pair LR3.HRM4 is represented by A and B and primer pair LR3.HRM6 is represented by C and D.

