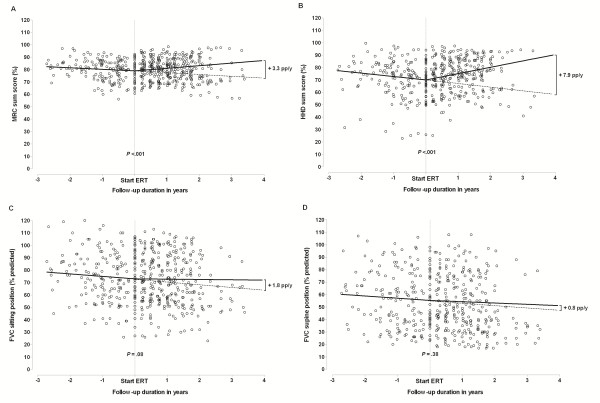
Figure 1.
The clinical course of disease before and after the start of enzyme replacement therapy (ERT) in the 49 patients with ERT and pre-ERT follow-up data for A) MRC sumscore; B) hand-held dynamometry (HHD) sumscore; C) forced vital capacity (FVC) in upright position; and D) FVC in supine position. The figure shows all the individual observations for the different outcome measures (shown as dots) and the solid lines represent the estimated mean trend in these observations as calculated by the ‘broken stick’ repeated-measures ANOVA. The dotted lines represent the extrapolated natural course slopes.

