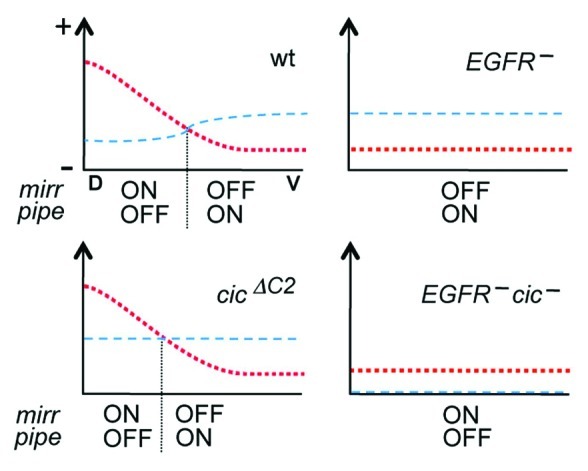
Figure 3. Model for the regulation of mirr and pipe expression in response to EGFR and Cic activities. Each diagram represents the regulatory inputs that control mirr expression in four different genetic backgrounds. For simplicity, only the anterior region of the egg chamber is represented along the DV axis (D, dorsal; V, ventral). The red dotted line represents the combined activation inputs from EGFR signaling and anterior positional cues that may depend on Dpp. The blue dashed line indicates the level of Cic-mediated repression. These inputs are proposed to define the position at which Mirr levels are sufficient to repress pipe (vertical dotted line), thereby establishing its border of expression. In cicΔC2 egg chambers, this position is shifted dorsally as a result of uniform Cic activity throughout the follicular epithelium. Note also that EGFR mutant backgrounds retain a weak activation input from anterior positional cues; this input is insufficient to drive mirr expression unless Cic repressor activity is absent.
