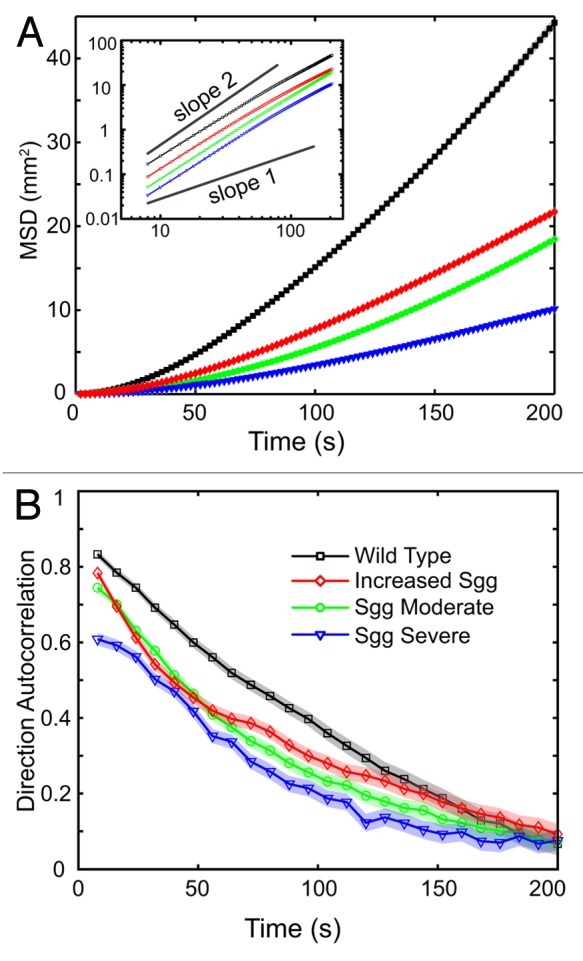
Figure 3. Both GSK-3 overexpression and reduction lead to dosage-dependent impairment of the crawling behavior. The MSD and DAC plots show that overexpression of dGSK-3 leads to a smaller velocity (A, inset) and more frequent turns (B). Two classes of larvae with different degrees of dGSK-3 reduction lead to decrease in velocity and increase in turning frequency. The severity of the phenotype correlates with the expression levels of dGSK-3. The ’SGG severe’ express less dGSK-3 than both wild type and ‘SGG moderate’ larvae and show a smaller velocity (A) as well as a larger turning frequency (B). Error is standard error of the mean and is shown as a shadowed region around the trace for clarity. MSD error is smaller than the data point symbols and not shown on the logarithmic plot for clarity. Symbols and colors: black squares are wild type, red diamonds are increased Sgg, green circles are Sgg moderate and purple triangles are Sgg severe larvae, arranged in this order from top to bottom in the MSD plot in (A). [Number of larvae tracked: WT (22), Increased SGG (19), SGG Moderate (24), SGG Severe (17)]
