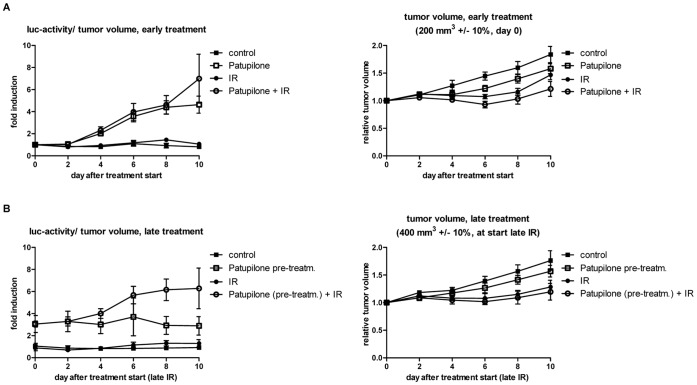
Figure 6. Tumor hypoxia in response to the combination of patupilone and ionizing radiation.
(A) Luciferase activity and tumor growth of A549 ODD-Luc-derived xenografts in response to patupilone (2 mg/kg, day 0) and ionizing radiation (3×1 Gy, day 1–3) alone and in combination, treated at a tumor volume of 200 mm3±10%. (ncontrol = 7; nIR = 5; npatupilone = 19; ncombined = 5) (B) Luciferase activity and tumor growth of A549 ODD-Luc-derived xenografts in control and patupilone-pretreated mice. Irradiation was performed at a tumor volume of 400 mm3±10% (control) or 10 days after patupilone-pretreatment, (ncontrol = 7; nIR = 5; npatupilone = 6; ncombined = 5). Data used in Figure 4 and 5 are replotted into this figure for better comparison of the treatment groups. Error bars represent mean ±SE of fold induction luciferase activity/tumor volume or relative tumor volume per group.

