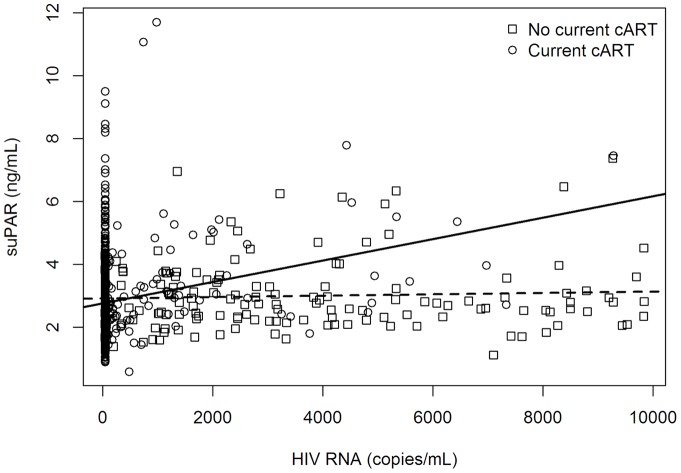
Figure 2. The association of suPAR and viral load according to treatment status.
The figure represents a scatter plot of the association between suPAR and viral load. Circles represent cART-treated patients (N = 838); boxes represent non cART-treated patients (N = 152). The regression line for cART-treated patients is continuous; the regression line for non-cART treated patients is dashed. The lower level of detection of HIV RNA in this study was 39 copies/mL. Abbreviations: cART: Combination antiretroviral treatment; suPAR: soluble urokinase plasminogen activator receptor.

