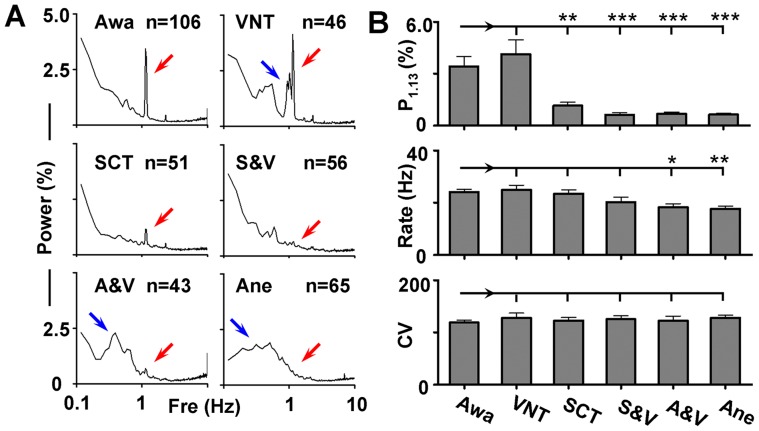
Figure 4. Dependence of VO on sensory pathways and consciousness.
(A) Averaged power spectra from awake (Awa) rats, rats treated by vagus nerve transection (VNT), spinal cord transaction (SCT), VNT and SCT (V&S), anesthesia under ventilation (A&V), and anesthesia (Ane). Red arrows indicate the position of 1.13 Hz in the spectra, and blue arrows indicate multi-peaks around the VO in VNT neurons and slow oscillation under anesthesia. (B) Bar graphs showing the peak power in 1.13 Hz (P1.13), firing rate, and coefficient of variation (CV) of the inter-spike intervals under different procedures. *p<0.05; **p<0.01; ***p<0.001 (one-way ANOVA followed by post hoc Tukey test, compared with Awa group).

