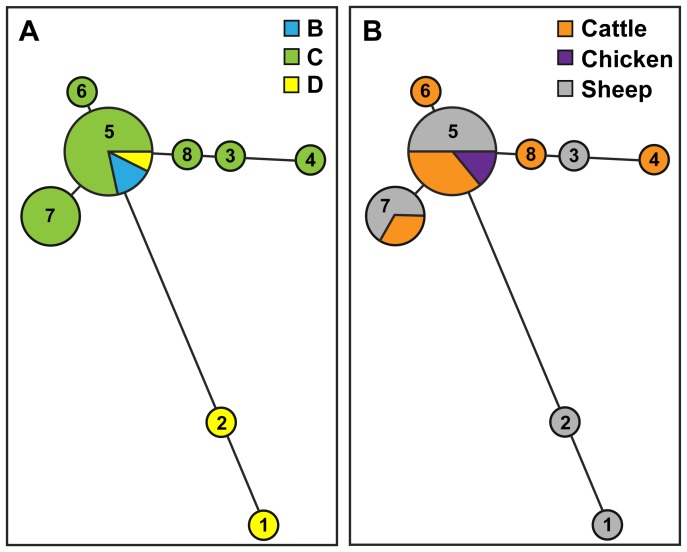
Figure 3. Phylogenetic relationships of MLVA types for the 26 O157:H7 STEC isolates.
A minimum-spanning tree of MLVA types was generated with Bionumerics software v6.1 and the Manhattan distance algorithm. Each circle in the tree represents a different MLVA type, and the number in the circle indicates the MLVA type number. The circle size corresponds to the number of isolates with an identical MLVA type. Colors represent the sampling sites (A) or the sampling source (B) for each MLVA type.

