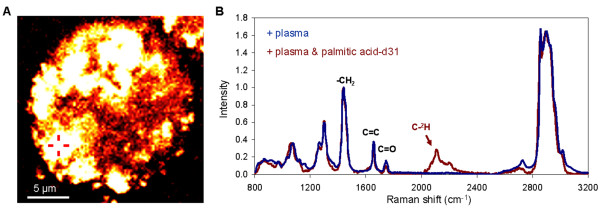
Figure 6.
Tracking the uptake of deuterated palmitic acid with Raman microspectroscopy. (A) CARS image of a C4-2 cell at 24 hours after incubation with 50% human plasma spiked with 50 μM of palmitic acid d-31. Cross-hair indicates a representative location for Raman microspectroscopy analysis. (B) Representative of Raman signatures of C4-2 cells incubated in 50% human plasma (blue) or in 50% human plasma spiked with deuterated palmitic acid d-31 (red) for 24 hours.

