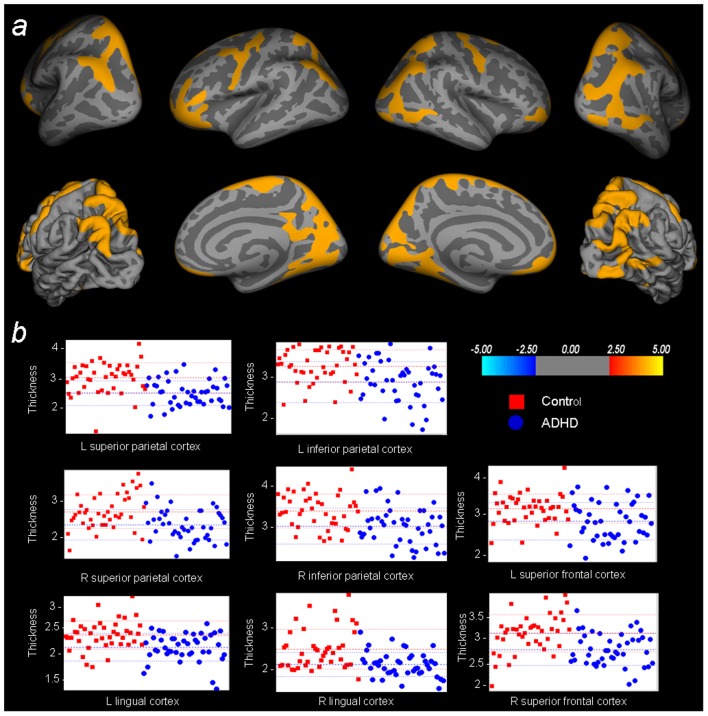
Figure 1. Whole-brain cortical thickness comparisons child sample.
A) Statistical maps of the contrast ‘Control child>ADHD child’ (colors encode the −log10(p-value)), overlaid on inflated and pial brain surfaces. The results are thresholded at p<0.05, MCTSB corrected for multiple comparisons. B) Plots depicting the thickness values of the participants for the peak vertex of the primary clusters resulting from this comparison.

