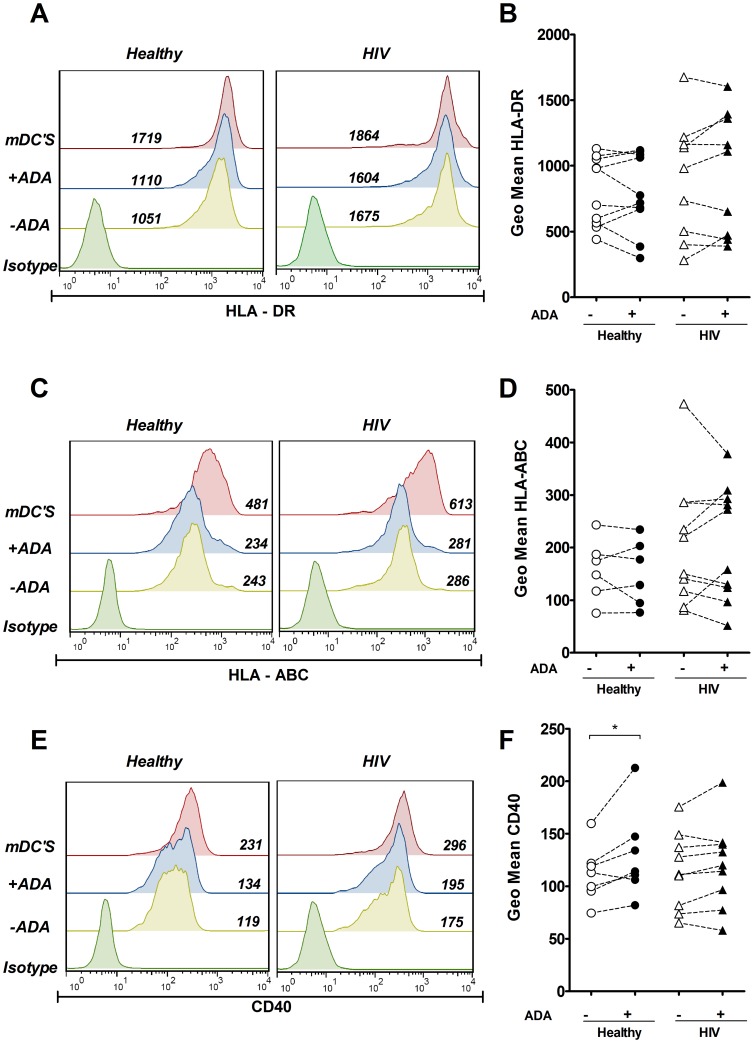
Figure 2. ADA effect on CD40 and HLA expression on iDCs.
iDCs, obtained as indicated in the Materials and Methods, were cultured for 48 h in medium in the absence (−ADA) or in the presence (+ADA) of 2 µM ADA or in the presence of maturating cocktail (mDCs). Expression of HLA-DR (A and B), HLA-ABC (C and D) or CD40 (E and F) in the DCs gate was measured by flow cytometry. In A, C and E, histogram overlays and the geometric mean from a representative healthy donor and HIV-infected patient are shown. In B, D and F, values obtained from 6 to 10 healthy donors (circles) or 9 to 10 HIV-infected subjects (triangles) in the absence (open symbols) or in the presence (filled symbols) of 2 µM ADA. Values obtained from 6 to 10 healthy donors (circles) or 9 to 10 HIV-infected subjects (triangles). * P<0.05.

