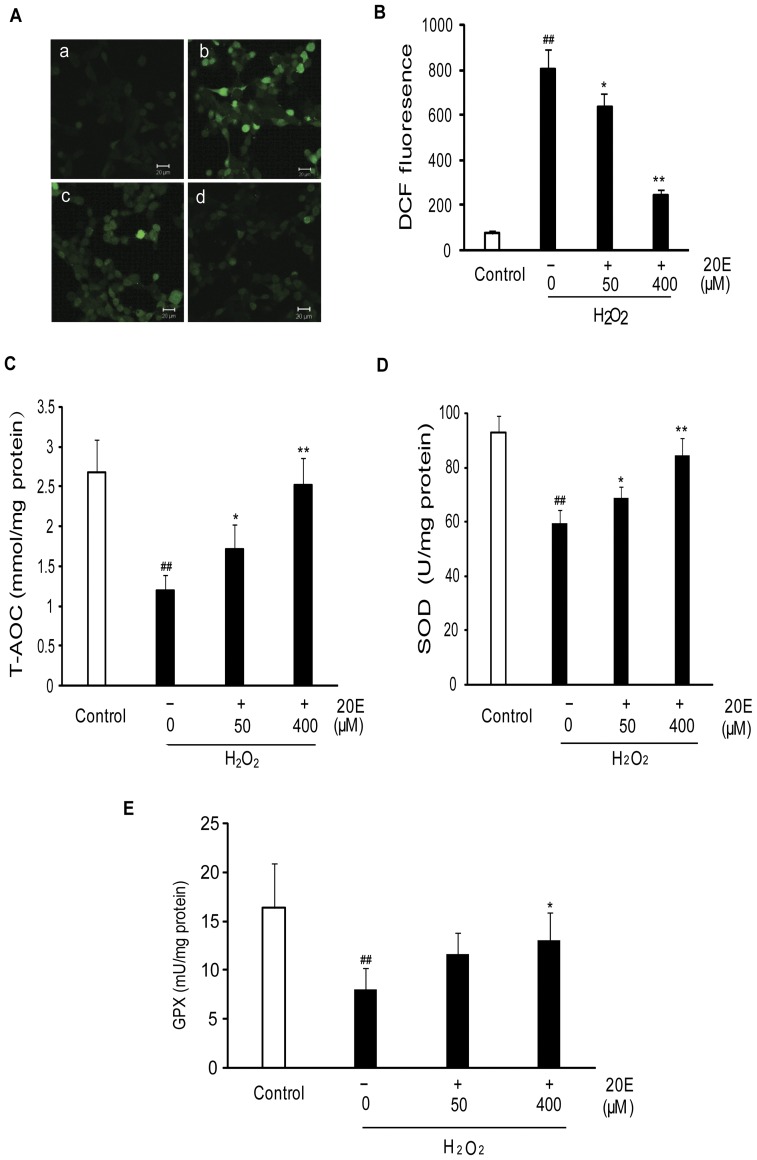
Figure 3. Effect of 20E on H2O2-induced oxidative stress in B35 cells.
Cells were pretreated with 50 or 400 µM 20E for 24 h before a 12 h incubation with H2O2. Then these treated cells were loaded with 30 µM DCF-DA for 30 min. A: Intracellular ROS levels were determined based on DCF fluorescence by confocal laser microscopy. a: control; b: H2O2 treatment; c: 50 µM 20E-pretreatment for 24 h before H2O2 exposure; d: 400 µM 20E-pretreatment for 24 h before H2O2 exposure. B: DCF fluorescence was measured by flow cytometry. Histogram showing the intracellular fluorescence intensity of DCF in different treatment cells. Data are reported as the means ± S.D. from three independent experiments. Non-treated cells served as controls. ## p<0.01 vs. Control, * p<0.05 vs. H2O2 alone, ** p<0.01 vs. H2O2 alone. C: Histogram showing cellular T-AOC in different treatment cells. D: Histogram showing cellular SOD activity in different treatment cells. E: Histogram showing cellular GPX levels in different treatment cells. Data are reported as the means ± S.D. from four independent experiments in triplicate. Non-treated cells served as controls. ## p<0.01 vs. Control, * p<0.05 vs. H2O2 alone, ** p<0.01 vs. H2O2 alone.

