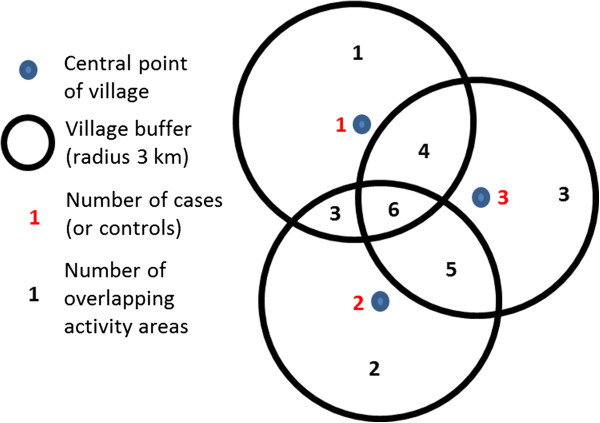
Figure 2.

Schematic diagram showing buffer areas surrounding village centres and the calculation of number of overlapping activity areas.

Schematic diagram showing buffer areas surrounding village centres and the calculation of number of overlapping activity areas.