
Figure 2.
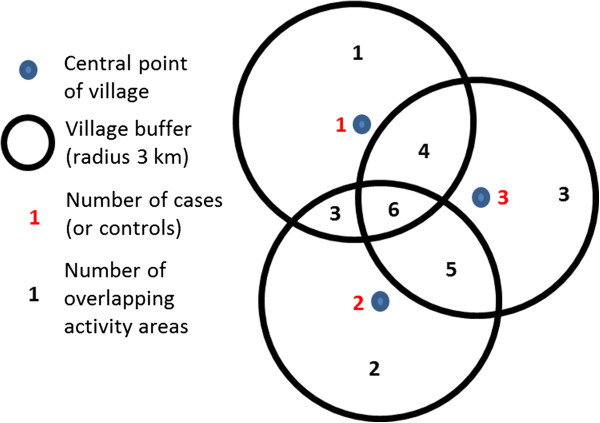
Schematic diagram showing buffer areas surrounding village centres and the calculation of number of overlapping activity areas.
Official websites use .gov
A
.gov website belongs to an official
government organization in the United States.
Secure .gov websites use HTTPS
A lock (
) or https:// means you've safely
connected to the .gov website. Share sensitive
information only on official, secure websites.
Schematic diagram showing buffer areas surrounding village centres and the calculation of number of overlapping activity areas.