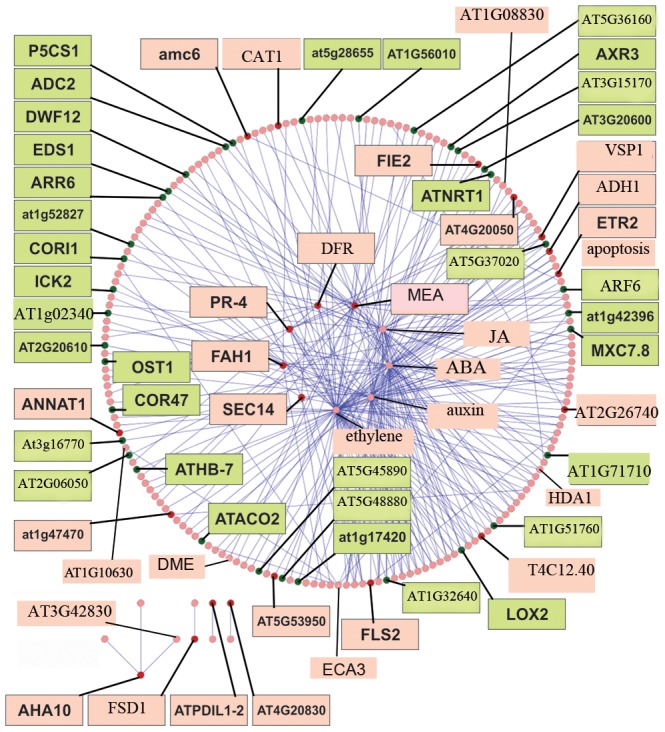
Figure 1. Subtracted interaction network of some nodes based on biological processes.

MEA, DFR, JA, ABA, auxin, ethylene, SEC14, FAH and PR-4 formed an interconnected sub-network, while AHA10, FSD1, ATPDIL1-2 and AT4G20830 formed a separate, small sub-network. The network was visualized using Cytoscape software. Upregulated proteins are colored red, and downregulated proteins are colored green. The Excel file of the map can be found in Table S4.
