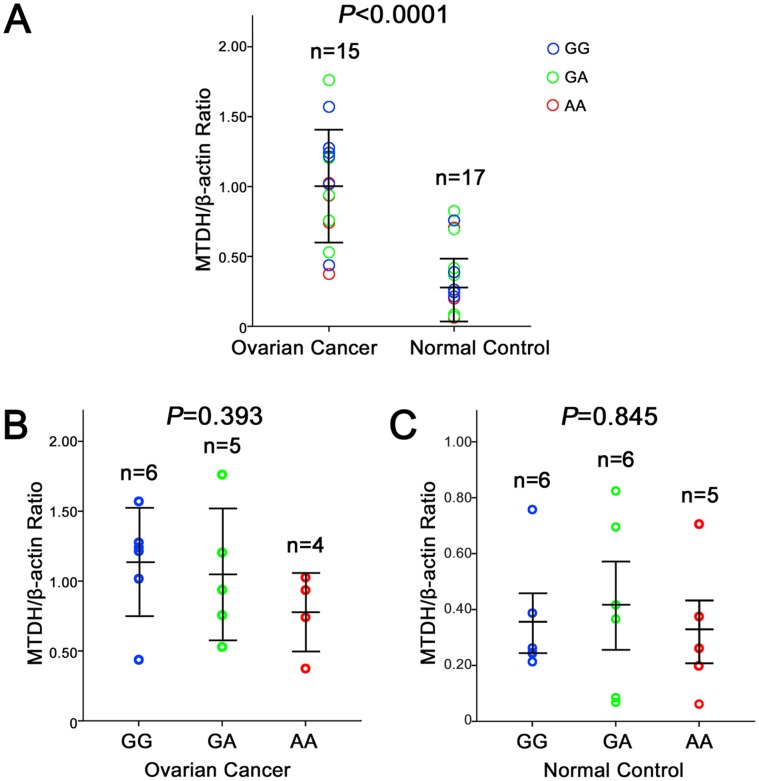
Figure 2. Association of the −470G>A genotype and MTDH (−470G>A) protein expression.
A, Relative level of MTDH protein expression in ovarian cancer tissues compared to normal ovarian tissues. B, Relative level of MTDH protein expression in the ovarian cancer tissues of patients with different −470G>A genotypes. C, Relative level of MTDH protein expression in normal tissues of individuals with different −470G>A genotypes. One circle represents the mean of three independent measurements from one patient. The distribution of the three genotypes were random between the groups. N represents the samples number of respective group. Bars represent the standard deviation. Student’s t test was used to evaluate the differences in the expression levels of different constructs.

