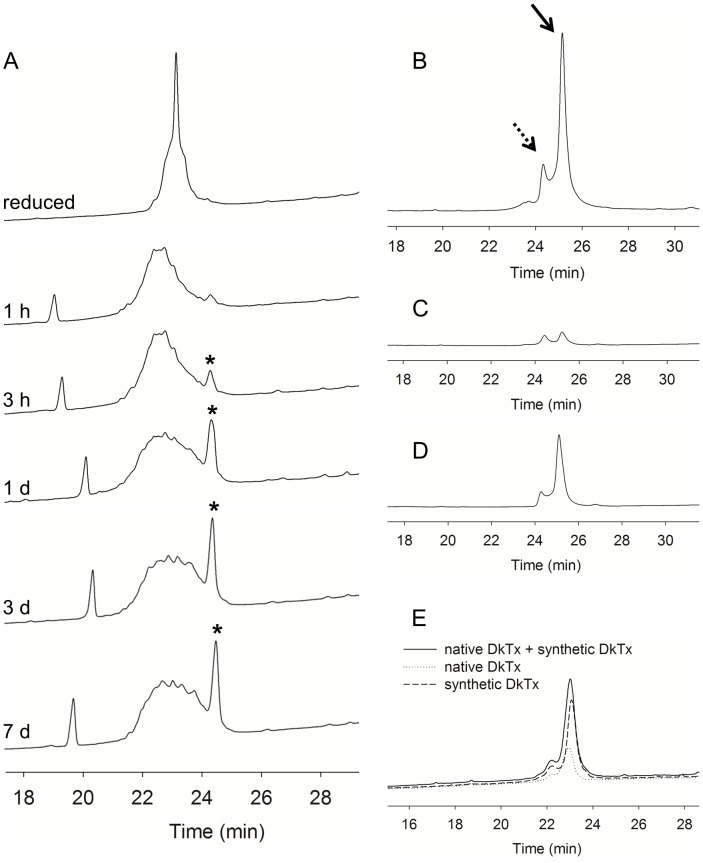
Figure 4. HPLC profiles of DkTx during the folding reaction.
The peptides were separated using a linear gradient of 5–65% solvent B for 30 min at a flow rate of 1 ml/min, where solvent A was water containing 0.1% TFA and solvent B was acetonitrile containing 0.1% TFA. (A) Oxidative folding of DkTx in redox buffer was monitored by HPLC. Asterisks indicate correctly folded DkTx. (B) HPLC chromatogram of purified DkTx. Dashed and solid arrows indicate the minor and major forms of DkTx, respectively. (C) The minor form was collected and re-injected after 75 min. (D) The major form was collected and re-injected after 175 min. (E) Co-injection of native and synthetic DkTx.

