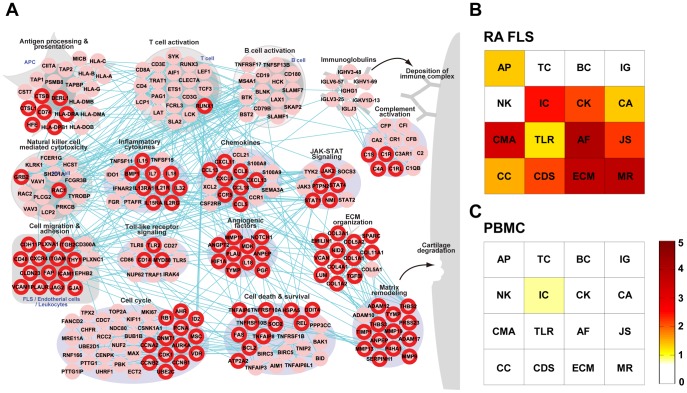
Figure 2. A RA-perturbed network in the RA synovium and signatures of FLS and PBMC in the RA tissue network.
A) A RA-perturbed network describing RA associated cellular processes in which 242 up-regulated RAGs are involved and their interactions. The network nodes are arranged into sixteen modules based on their GOBPs and the KEGG pathways that they belong to. The nodes with red boundary represent DEGs in RA FLS. B) and C) Module enrichment scores (see text for definition) representing the significances of overlaps of the DEGs in RA FLS (B) or PBMC (C) with the genes belonging to the sixteen network modules. See text for detailed discussion. AP = Antigen processing & presentation; TC = T-cell activation; BC = B-cell activation; IG = Immunoglobulins; CA = Complement activation; NK = Natural killer cell mediated cytotoxicity; IC = Inflammatory cytokines; CK = Chemokines; CMH = Cell migration & adhesion; TLR = Toll-like receptor signaling; AF = Angiogenic factors; JS = JAK-STAT signaling; CC = Cell cycle & DNA repair; CDS = Cell death & survival; ECM = ECM organization; MR = Matrix remodeling.

