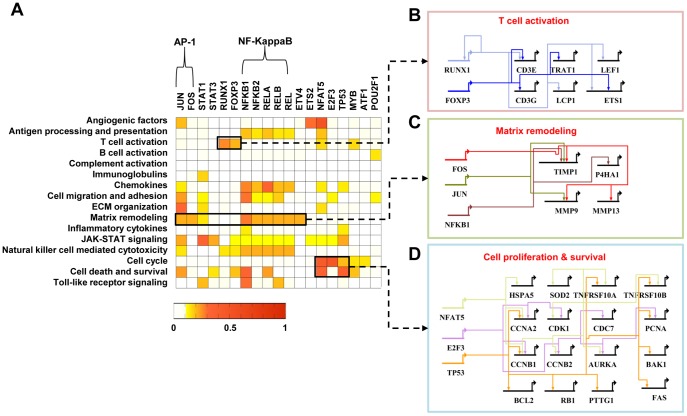
Figure 4. Gene regulatory networks activated in RA.
A) Target enrichment scores representing the significances of overlaps between the targets of each TF and the RAGs belonging to the network modules. B–D) Gene regulatory networks describing the TF-target relationships for the three processes: T-cell activation including RUNX1 and FOXP3 (B), Matrix remodeling including AP-1 (JUN and FOS) and NFKB1 (C), and Cell proliferation and survival including NFAT5, E2F3, and TP53 (D).

