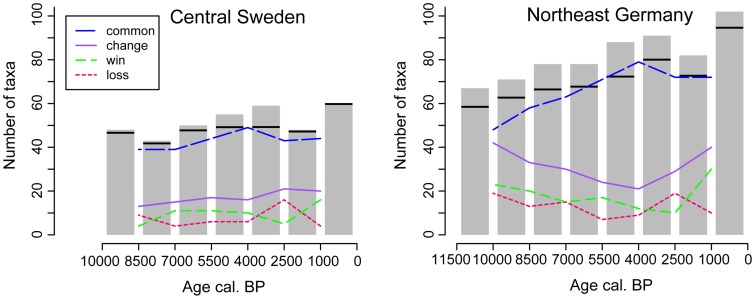
Figure 5. Changes in pollen type diversity in the combined datasets for the northern and southern sites.
Bars mark the absolute number of taxa in combined samples over time periods of 1000 and 1500 years. Horizontal bars indicate the number of pollen types in 43363 grains (the smallest number of all bins) allowing comparisons between regions. Lines indicate the direction of change in taxa composition between combined samples: common = number of common taxa between two adjacent combined samples; win = number of taxa gained from one period to the next; loss = number of taxa lost from one period to the next; change = sum of win and loss indicating species turnover. The analysis is based on the pollen types from upland vascular plants without archaeophytes or neophytes (set B).

