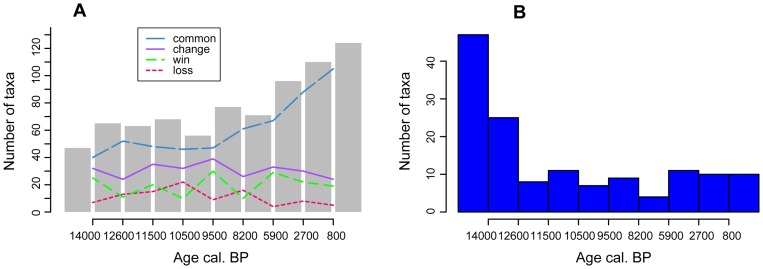
Figure 6. Pollen type diversity and first occurrence in the Berlin/Brandenburg database of selected taxa.
A) Bars mark the number of different taxa found per time interval. Lines indicate the direction of change in taxa composition between combined samples: common = number of common taxa between two adjacent combined samples; win = number of taxa gained from one period to the next; loss = number of taxa lost from one period to the next; change = sum of win and loss indicating species turnover. B) Histogram showing the number of taxa that appear for the first time in a given time interval.

