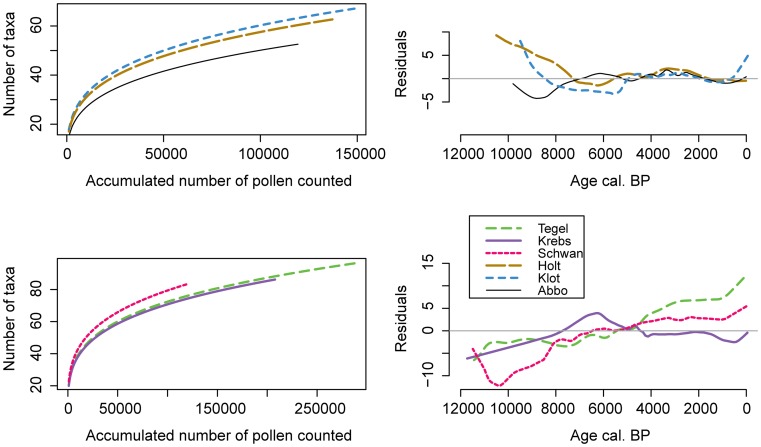
Figure 8. Power functions and residuals of the expected versus observed number of accumulated pollen types.
Linear regression models with constant slope and varying intercepts were fitted to the taxa accumulation plot (Figure 7A). Left panels show these power functions in normal space and the right panels show the residuals indicating the difference between the observed and the expected number of accumulated taxa through time. A lowess smoother with a span of 0.1 was applied to emphasise trends. Only pollen types from upland vascular plants without archaeophytes or neophytes (set B) were considered.

