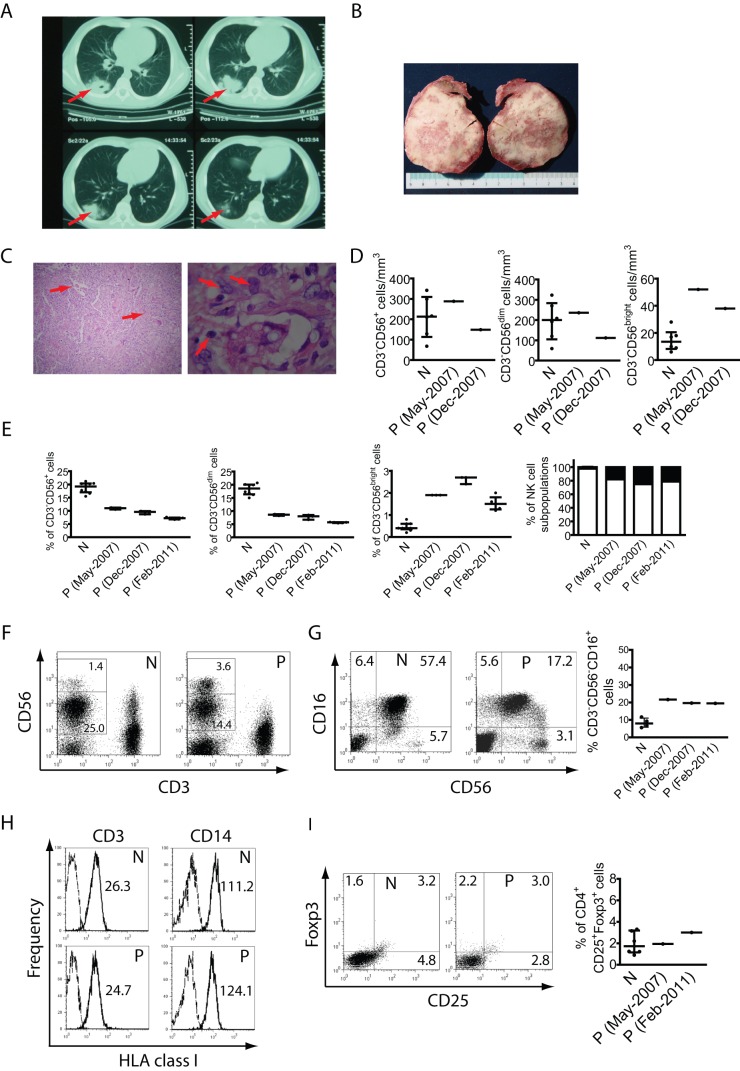
Figure 1. Lung infection and analysis of blood mononuclear cells.
A) CT scan of the lungs of the patient, showing an area of consolidation of 43×60 mm in right lower lobe parenchyma (indicated by arrows). B) Lung biopsy (sliced in two pieces) with visible cavitated lesions with mucoid material. C) Hematoxylin/eosin staining of the lung biopsy showing the infiltration of inflammatory cells with predominance of histiocytes and multinucleated giant cells containing PAS-positive spherical bodies of 5 to 10 μm in diameter (indicated by arrows). The morphological characteristics of these PAS-positive spherical bodies are compatible with Cryptococcus neoformans infection. D) Absolute numbers of total NK cells, CD3−CD56dim cells and CD3−CD56bright cells in blood of 6 healthy normal donors (N) and in blood from two draws from different dates (indicated in parentheses) from the patient (P). E) PBMCs from 9 different normal donors (N) and from different blood draws from different dates (indicated in parentheses) from the patient (P) were stained with anti-CD3 and anti-CD56 mAbs, and the percentage of NK cells (CD3−CD56+ cells), CD3−CD56dim and CD3−CD56bright cells within the whole mononuclear cell population (PBMCs) were calculated and depicted as dot plots. Also, the relative abundance of CD3−CD56bright and CD3−CD56dim cells was calculated and depicted (CD3−CD56bright are shown in black bars; CD3−CD56dim cells are shown in white bars). Each sample of the patient was tested at least twice, and individual values obtained are shown as a dot in the graphs. Interquartile ranges (IQR) are indicated in the graphs of panels D and E. F) Representative dot plots of lymphoid cells gated according to their FSC and SSC parameters. The numbers in each region correspond to the percentage of CD3−CD56dim and CD3−CD56bright cells within the lymphoid population (gated according to their FSC and SSC parameters). G) Representative dot plots to show the percentage of CD3−CD56−CD16+ NK cells within the CD3− lymphoid cell population in a healthy normal control (N) and in one sample of the patient (P). The numbers in each quadrant correspond to the percentage of CD16+CD56−, CD16+CD56dim and CD16−CD56bright NK cells. Right graph: data from 3 healthy normal controls and 3 blood samples from different dates from the patient (P). Percentages depicted correspond to the percentage of CD3−CD56−CD16+ cells within the total NK cell population (CD16+CD56− + CD16+CD56dim + CD16−CD56bright cells). H) PBMCs from normal donors (N) and from the patient (P) were stained with anti-CD3, anti-CD14 and anti-HLA class I mAbs to assess HLA class I expression (continuous line) on T cells (CD3+ cells) and monocytes (CD14+ cells). Data presented correspond to representative histograms. Dashed lines: IC mAb. The numbers inserted in the graphs correspond to the MFI. I) PBMCs from normal donors (N) and from the patient (P) were stained with anti-CD4, anti-CD25 and anti-Foxp3 to assess the percentage of Tregs. The dot plots correspond to Foxp3 vs. CD25 in CD4+ cells gated from the FSC vs. SSC plots. The percentages in each quadrant are shown. The right graph shows the percentage of Tregs in PBMCs from 6 healthy normal controls and in two blood samples from different dates (indicated in parentheses) from the patient (P). One representative experiment from 3 independent analyses is shown in C and D. PBMCs from blood samples obtained in February 2011 were used for panels F, H and I.

